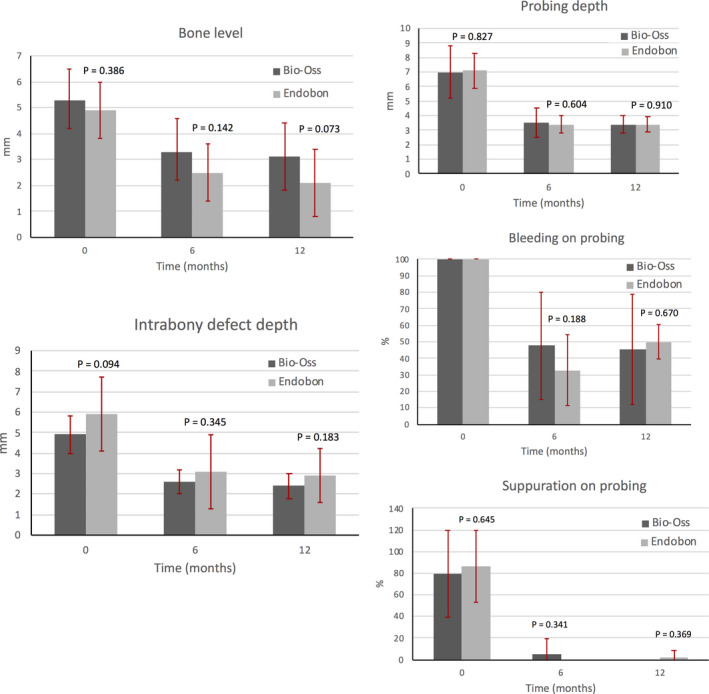
FIGURE 3.

Radiographic and clinical parameters around the implants at baseline, 6 months and 12 months after treatment in both groups. There were no statistically significant differences between BO and EB in any of the parameters that were examined. The error bars represent the standard deviations (SD).
