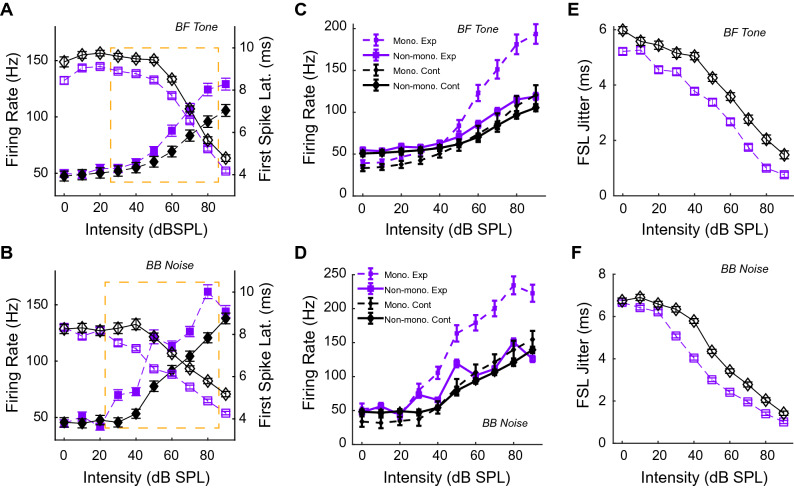
Figure 2.
Bushy cells in noise-exposed animals show hyperacusis-like firing patterns. RIFs (filled symbols; left axis) and LIFs (open symbols; right axis) from bushy cells in noise-exposed animals (purple squares with dashed lines) and non-exposed controls (black diamonds with solid lines) in response to (A) tones at unit BF and (B) broadband noise. Group suprathreshold intensity range indicated by dashed orange boxes. Units were classified as monotonic (dashed-lines) or non-monotonic (solid-lines) from noise-exposed animals (purple) or controls (black) for (C) tones at unit BF and (D) Broadband noise. FSL jitter, measured as the standard deviation of the FSL, is shown for (E) BF tones and for (F) broadband noise. Data shown are mean + /-SEM.

