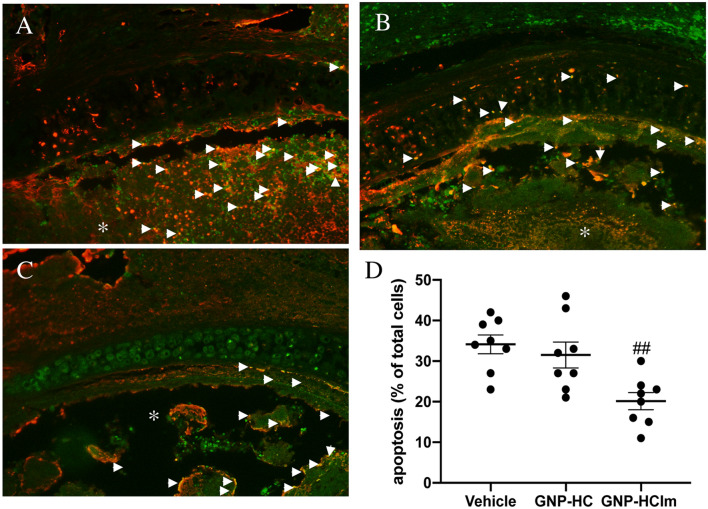
Figure 3.
Representative TUNEL assay to visualize the apoptotic rate (red signal; arrows indicate positive cells) of tracheal sections after all treatments. (A) Vehicle control sample, (B) GNP-HC and (C) GNP-HCIm. (D) Graphical quantification of TUNEL staining. Graph was done by Graphpad Prism 6.0; (https://www.graphpad.com/scientific-software/prism/). Asterisks = lumen of trachea. 20 × magnification is shown. Data were represented as mean (N = 8 for each group) ± SEM and analyzed by one-way ANOVA followed by a Bonferroni post-hoc test for multiple comparisons. ###p < 0.05. Scale bar = 100 µm.

