Figure 5.
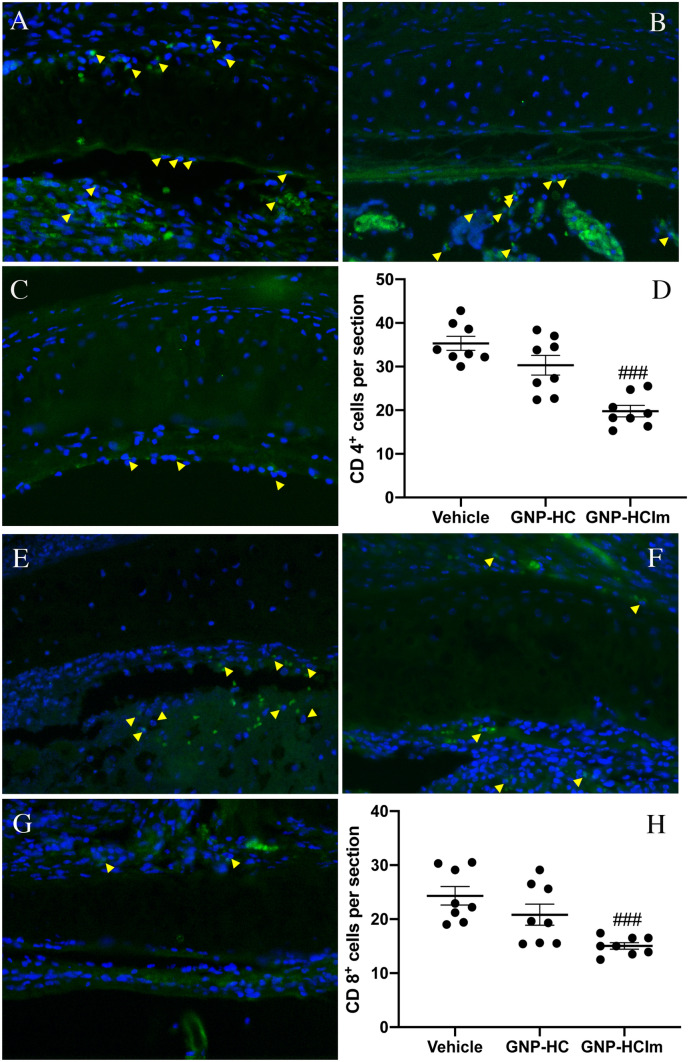
(A–C) Representative images of explanted trachea sections after (A) vehicle, (B) GNP-HC and (C) GNP-HCIm stained with antibody against CD4. (D) Graphical quantification. (E–G) Representative images of explanted trachea sections after (E) vehicle, (F) GNP-HC and (G) GNP-HCIm stained with antibody against CD8. (H) Graphical quantification. For CD4 and CD8 staining, a 20 × magnification is shown. Graphs were done by Graphpad Prism 6.0; (https://www.graphpad.com/scientific-software/prism/). Data were represented as mean (N = 8 for each group) ± SEM and analyzed by one-way ANOVA followed by a Bonferroni post-hoc test for multiple comparisons. ###p < 0.05. Scale bar = 100 µm.

