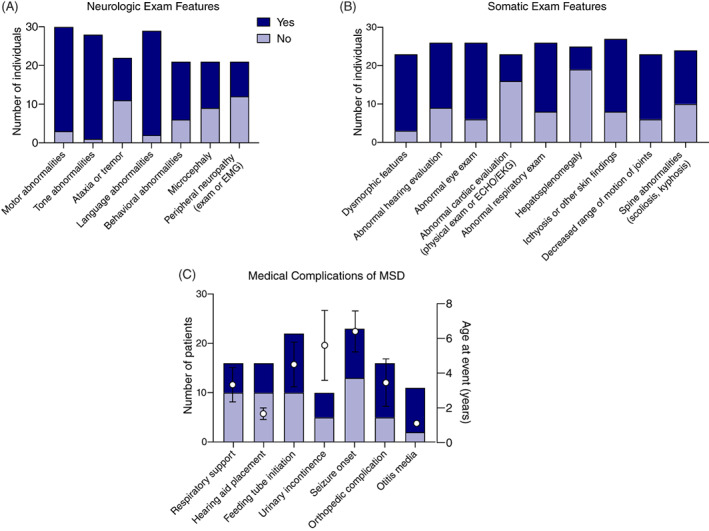
FIGURE 2.

Key time to event measures and clinical features in MSD. A, Key disease‐specific clinical outcomes, and B, C, exam features were collected in the medical records as available. Events or features were classified as either yes (event/feature noted at any point in the medical record; dark blue) or no (event/feature noted not to have occurred; light blue). The total number of records with available information is noted on the left y‐axis. For medical complications (time to event measures), the mean age (± SE of the mean) at which the first event occurred is shown (right axis, black circles)
