FIGURE 8.

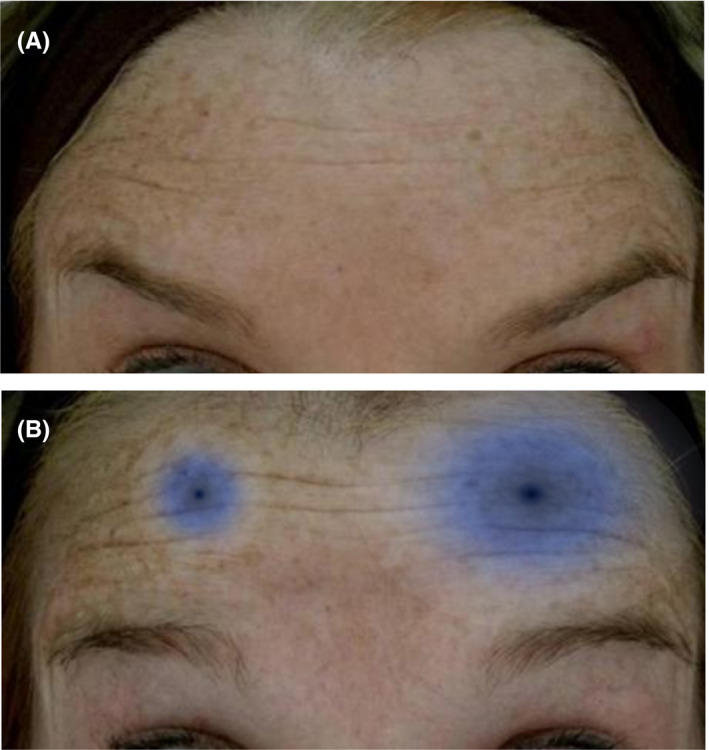
Difference in area of effect due to differing reconstitution volumes; 1.5cc (small blue circle) versus 2.5cc (large blue circle); baseline on the left, day 14 on the right 116

Difference in area of effect due to differing reconstitution volumes; 1.5cc (small blue circle) versus 2.5cc (large blue circle); baseline on the left, day 14 on the right 116