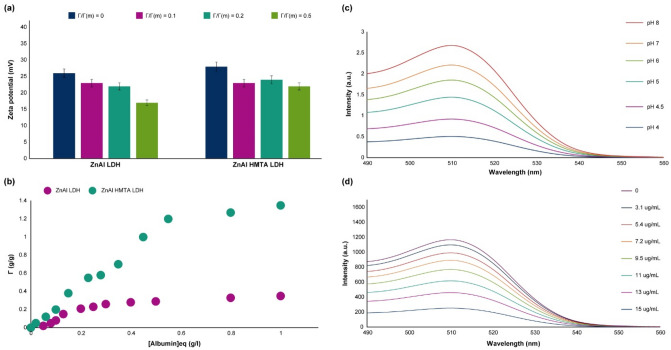
Figure 9.
(a) zeta potential dependency with Γ/Γ(m) ratio of the synthesized LDH, (b) Albumin adsorbed amount versus equilibrium concentration, (c) The spectra of fluorescence intensity of the EGFP/LDH in the presence of different pH environments (λex = 480 nm), (d) The spectra of fluorescence intensity of the EGFP/LDH in the presence of different concentrations of the protoporphyrins (λex = 480 nm; pH = 7; 0–15 µg mL−1). The indicate data are presented as the mean (± SD) from three independent experiments.

