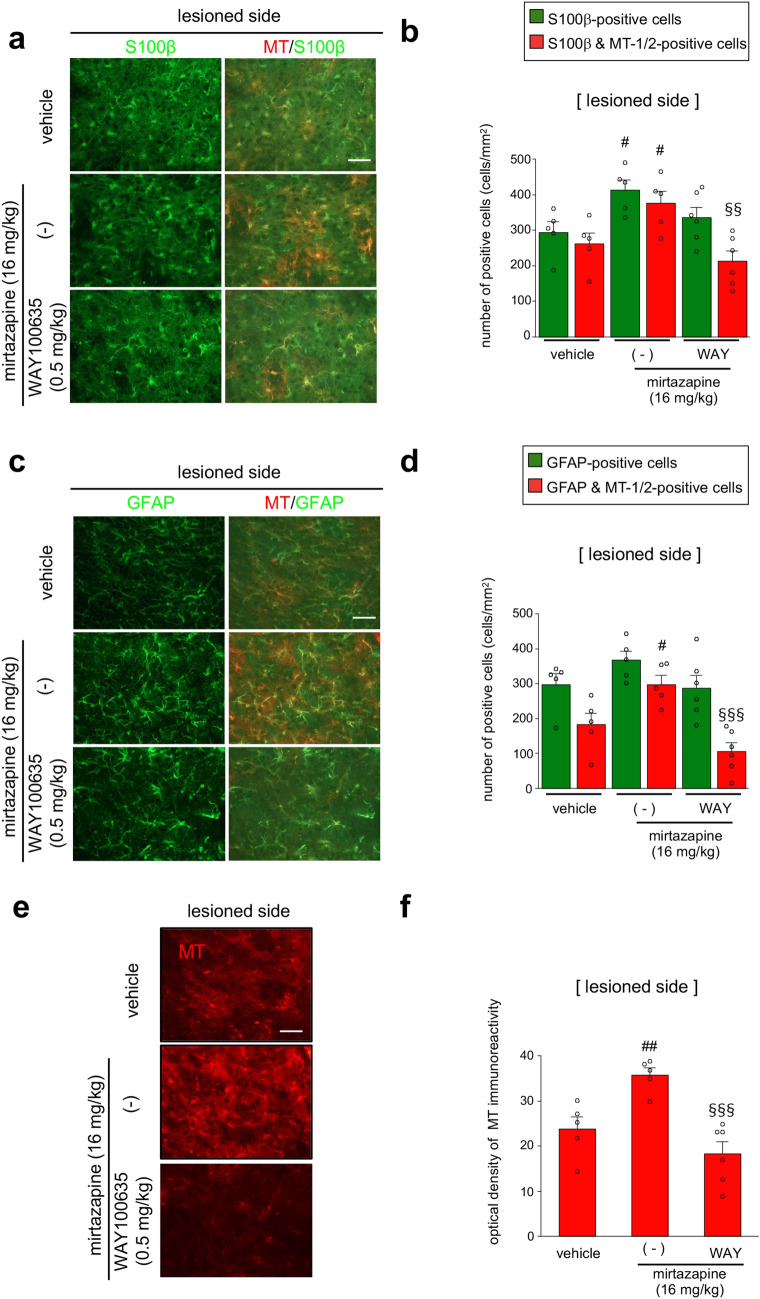
Figure. 3.
Mirtazapine promotes MT upregulation via 5-HT1A receptors. (a,c,e) Representative photomicrographs of immunohistochemistry for S100β (green) and MT-1/2 (red) (a), GFAP (green) and MT-1/2 (red) (c), and MT-1/2 (e) in the striatum of mirtazapine (16 mg/kg) and WAY100635 (WAY; 0.5 mg/kg) co-administered parkinsonian mice. Scale bar = 50 µm. (b) Quantification of the number of S100β- and MT-1/2-positive cells. (d) Quantification of the number of GFAP- and MT-1/2 positive cells. (f) Quantification of the optical density of MT-1/2-immunoreactivity. Data are presented as means ± SEM (n = 5–6). #p < 0.05 and ##p < 0.01 versus lesioned side of vehicle-treated group. §§p < 0.01 and §§§p < 0.001 vs. mirtazapine (16 mg/kg)-treated group.

