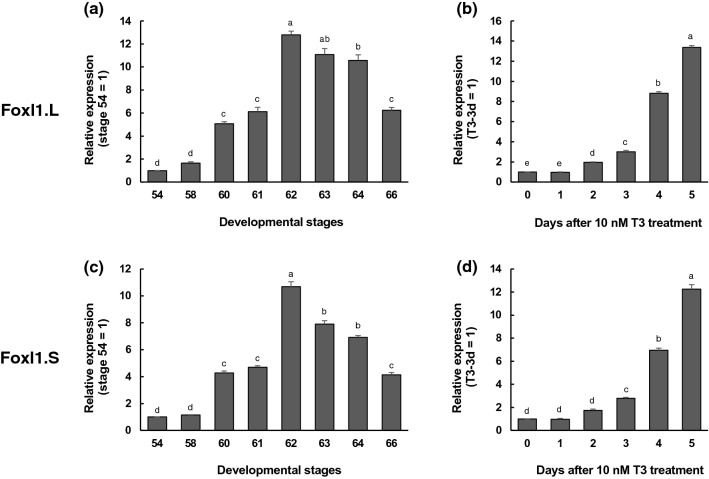
Figure 1.
Expression profiles of Foxl1 homeolog mRNAs in the small intestine during natural and T3-induced metamorphosis. Total RNA was prepared from the intestine of X. laevis tadpoles at indicated developmental stages (a,c) or Nieuwkoop and Faber (NF) stage 54-tadpoles after 10 nM T3 treatment (b,d) and was analyzed by qRT-PCR. Levels of Foxl1.L (a,b) and Foxl1.S mRNAs (c,d) are shown relative to those of ribosomal protein L8 (rpL8.S) mRNA, with the values at stage 54 or T3 for 0 day set to 141–43. Error bars represent the SEM (n = 4). The values were analyzed by ANOVA followed by Scheffe’s post hoc test. Different letters indicate significant differences among the indicated stages or days after T3 treatment (P < 0.05).

