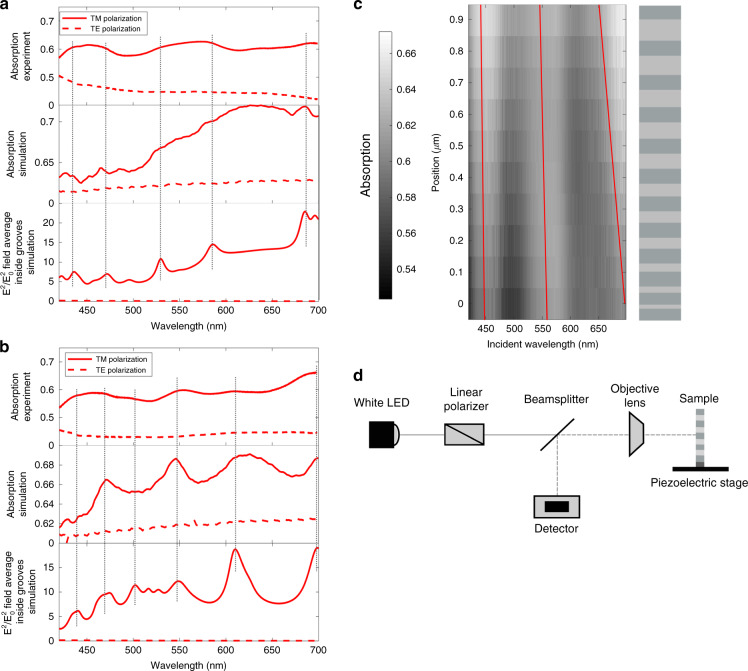
Fig. 5. Optical response of graded arrays in the near and far-field.
a, b Experimental and simulated 1−R absorption data and simulated |E|2/|Eo|2 electric field data for both TM and TE polarisations for a a width-graded array and b a bigradient array. c Experimental 1−R absorption data as a function of array position under TM polarisation for a width-graded array. The schematic illustrates the change in position across the array while the red lines visualise the shifting absorption bands. d Schematic illustration of the hyperspectral microscopy apparatus

