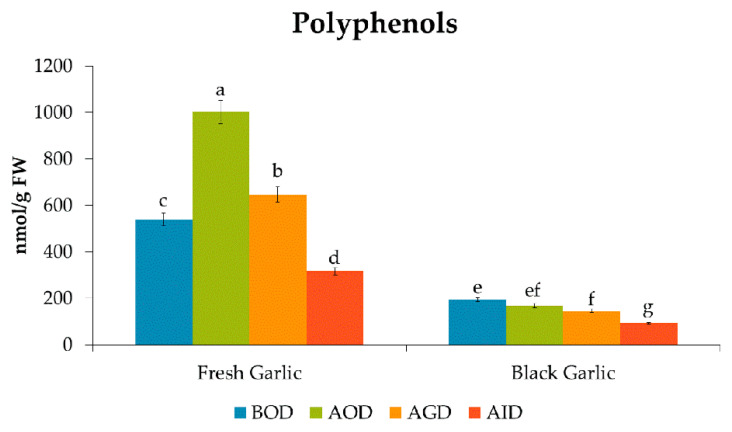
Figure 2.
Quantities of total polyphenols during the in vitro gastrointestinal digestion. Data are expressed as nmol/g FW as mean values (n = 6). Different letters (one-way ANOVA) denote statistically significant differences between the stages of simulated gastrointestinal digestion (p-value < 0.05). (BOD, Before Oral Digestion; AOD, After Oral Digestion; AGD, After Gastric Digestion; AID, After intestinal digestion).

