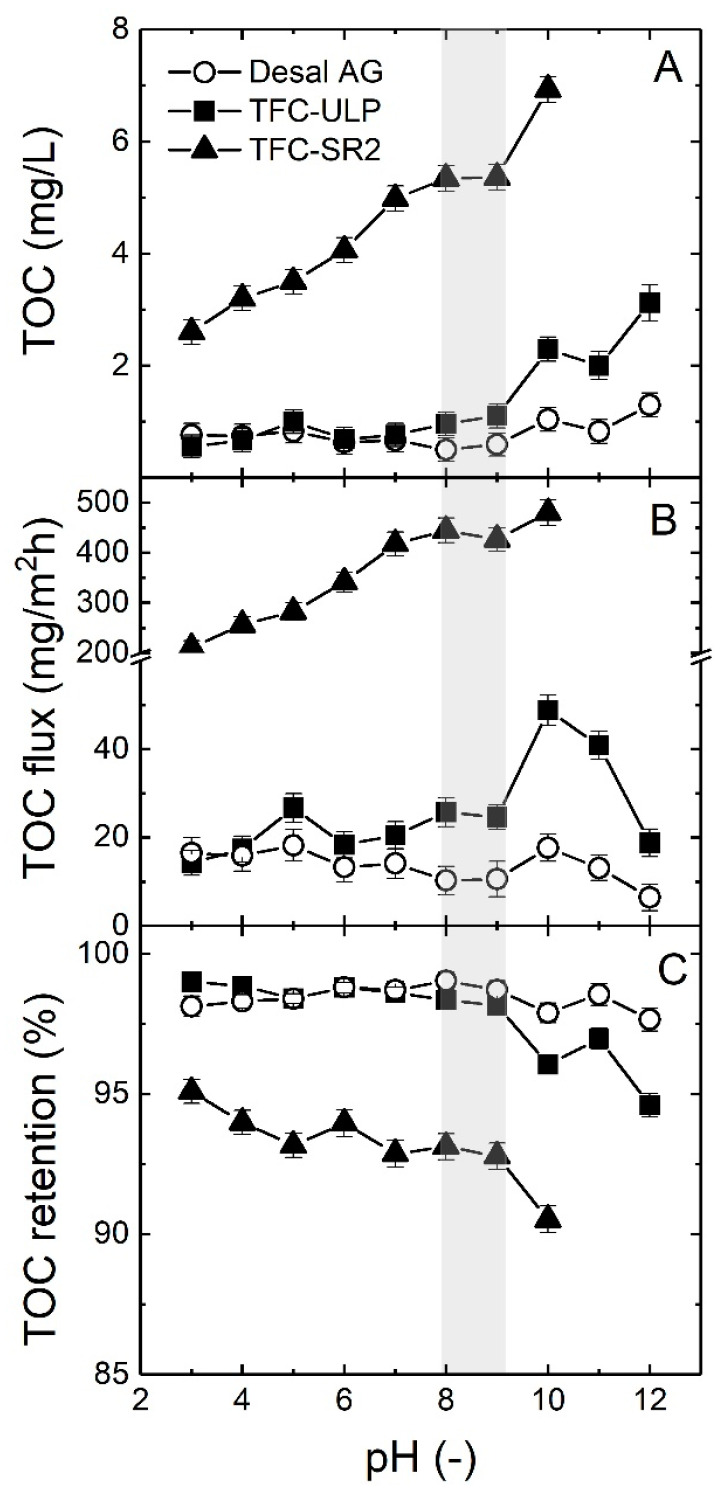
Figure 11.
(A) TOC permeate concentration, (B) TOC flux and (C) TOC retention as a function of the pH (3−12) of groundwater sample 5. The grey area is TOC removal at the pH range of groundwater samples 1−5. The applied pressure was 10 bar. Data adapted from [69].

