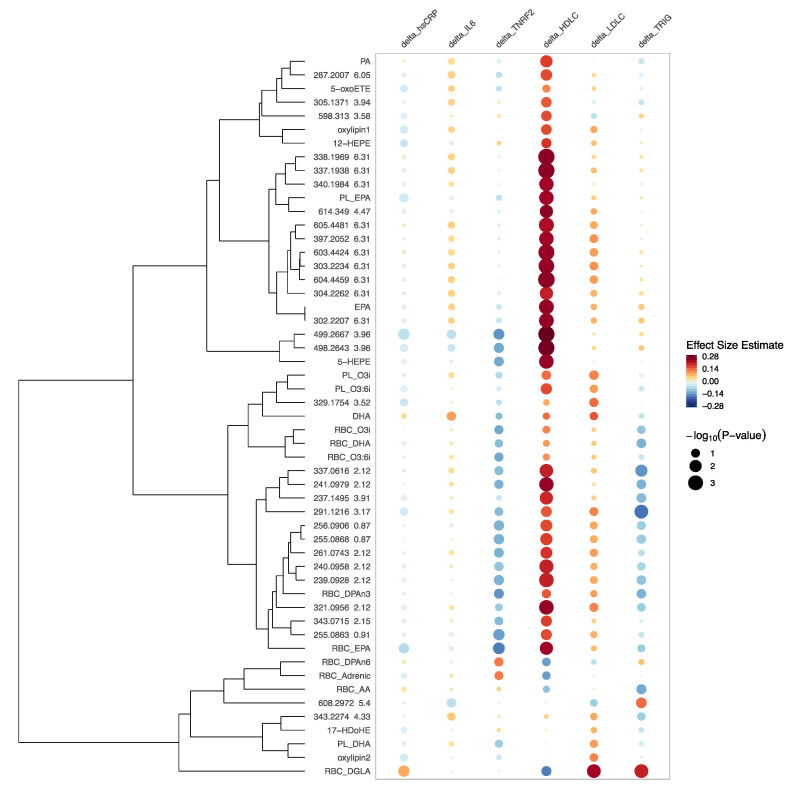
Figure 6.
Rainplot [17] of beta coefficients of the significant associations of one-year changes in clinical biomarkers (high-sensitivity C-reactive protein (hsCRP), interleukin-6 (IL6), tumor necrosis factor receptor 2 (TNRF2), HDLC, low-density lipoprotein cholesterol (LDLC) and triglycerides) with one-year changes in FAs, oxylipins and bioactive lipid features controlling for age, sex and race. Only significant with n-3 treatment and annotated FAs, oxylipins and bioactive lipids are reported here as well as 30 out of 143 most significant un-annotated bioactive lipid features (labeled with m/z and RT) with respect to their association with n-3 treatment. “PL_” in front of the name means that compound was measured by plasma PL assay; “RBC_” in front of the name means that it was measured by RBC assay; otherwise the LCMS assay was used. Assays: LCMS—high-throughput liquid chromatography–mass spectrometry of circulating free FAs, oxylipins and bioactive lipids in plasma; RBC—gas chromatography with flame ionization detection for red blood cells; PL—LCMS2 plasma phospholipids. PA—palmitic acid, oxylipins 1,2 could not be annotated due to the lack of the standard in the library, they are novel oxylipins reported in [12].

