Figure 1.
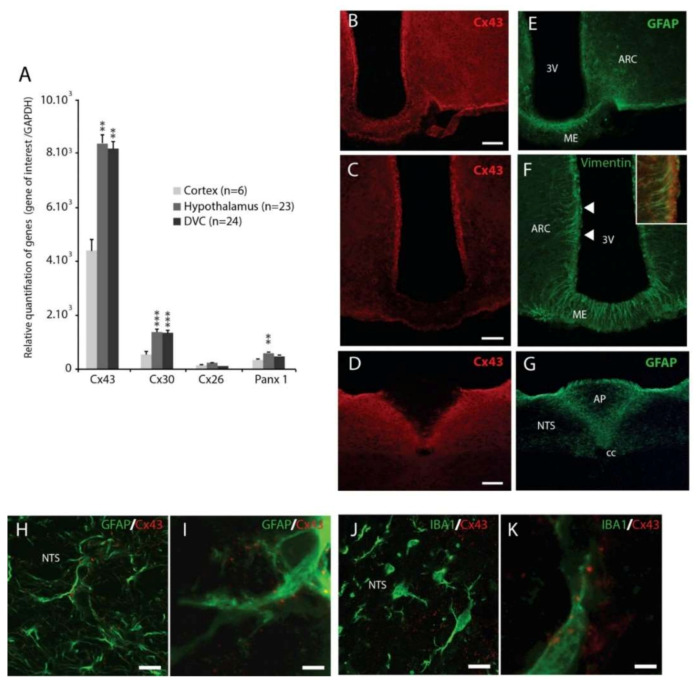
(A): Glial connexins and pannexin1 mRNAs quantification measured by reverse transcriptase quantitative polymerase chain reaction (RT-qPCR) in the cortex, hypothalamus and DVC of control mice (n = 6, 23 and 24 respectively). ** p < 0.01 and *** p < 0.001 compared to cortex. (B–G): Confocal images of Connexin-43 (Cx43) (red) and Glial Fibrillary Acidic Protein (GFAP) (E–G) or vimentin (F) double labeling immunohistochemistry performed within the hypothalamus and Dorsal Vagal Complex (DVC). Scale bar: 200 μm. Inset in F shows Cx43 and vimentin co-localization in α-tanycytes. (H,I): Confocal images Cx43 (red) and GFAP (green) double immunofluorescence within the DVC. Cx43 is strongly associated with astrocytes GFAP+ (green) processes. (J,K): Confocal images of Cx43 (red) and Ionized Ca2+ Binding Adapter Molecule 1 (IBA1) (green) double immunofluorescence within the DVC. Note that Cx43 labelling is sometimes found associated with thin processes of IBA+ microglia. Scale bars: 20 μm for (H, J) and 2 μm for (I) and (K). AP: area postrema, NTS: nucleus tractus solitarius, cc: central canal; ARC: arcuate nucleus, 3V: third ventricle, ME: median eminence.

