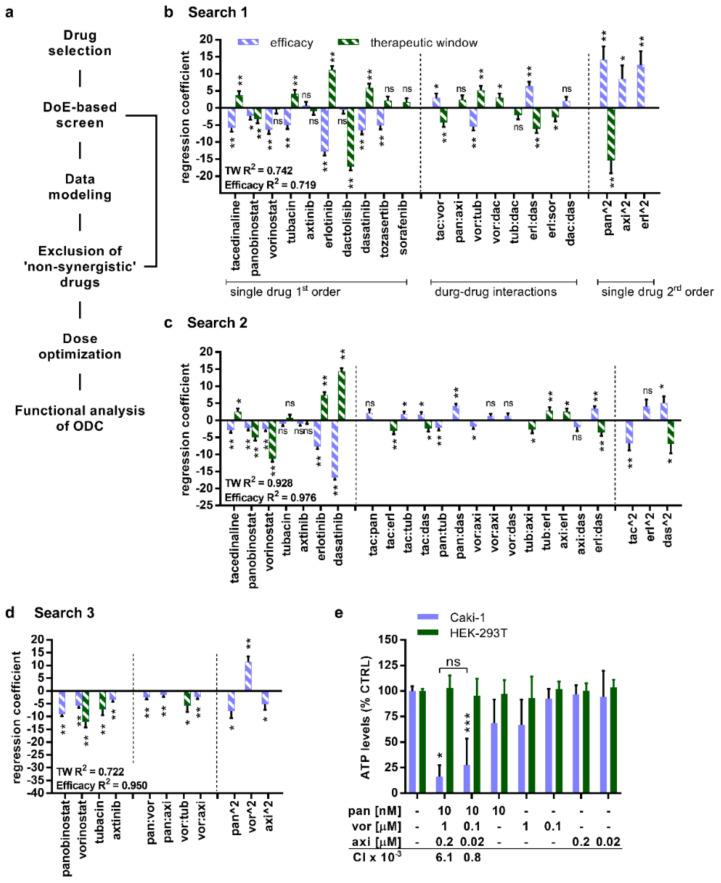
Figure 1.
Therapeutically guided multidrug optimization (TGMO) selects synergistically interacting drugs in a multidrug combination active in Caki-1 cells. (a) Scheme of the TGMO method. Regression coefficients express activities or interactions of the drugs selected for the (b) Search 1 (155 multi-drug combinations) in the TGMO screen (N = 2). To distinguish simultaneously the efficacy (violet striped bars) and the therapeutic window (green bars), the TGMO screen was performed in Caki-1 cells and to obtain a therapeutic window in non-malignant human embryonic kidney (HEK-293T) cells. (c) Search 2, where 50 multidrug combinations were tested experimentally (N = 2). (d) Search 3, 25 multidrug combinations (N = 2). (e) The activity and selectivity of the optimized multidrug combination, measured as the level of ATP in comparison to the CTRL (0.03% dimethylsulfoxid (DMSO) in culture medium) was analyzed in Caki-1 and HEK-293T cells (N = 5). The level of ATP is a measure of cell viability. The combinatorial index (CI) was calculated for the multidrug combination at selected doses related to Figure S6, representing that both combinations are synergistic (CI < 1). Error bars represent the SD and significance of regression coefficients was determined with a one-way ANOVA and is represented with * p < 0.05, ** p < 0.01, and *** p < 0.001. R2 represents model accuracy in a coefficient of multiple determinations. ns, not significant.

