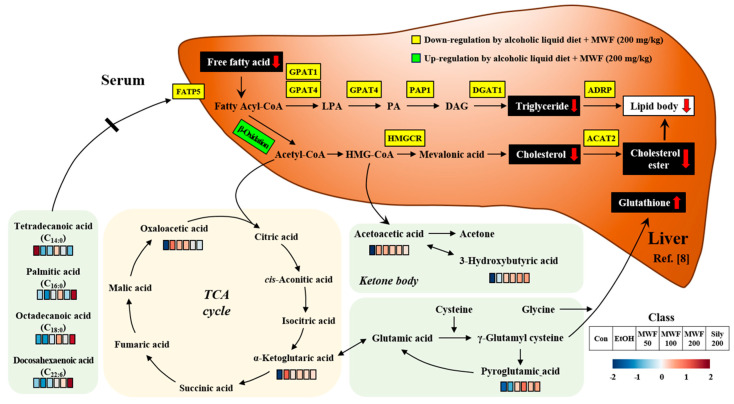
Figure 5.
Predicted association indicating key findings of MWF from serum metabolic profiling and hepatic molecular mechanism in chronic alcohol-fed rats [8]. The red bars indicate an increased level of metabolite compared to the Con group. The blue bars indicate a reduced level of metabolite compared to the Con group. The white bars indicate no significant differences of metabolite between the treated-group and the Con group. Levels of altered metabolites showed in Table 1 and Supplementary Table S1.

