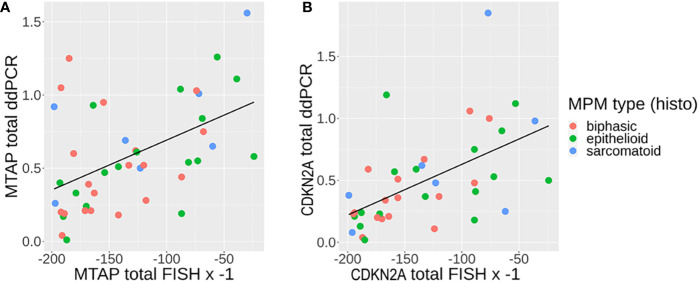
Figure 4.
(A, B) Correlation between fluorescence in situ hybridization (FISH) (multiplied by −1, since any one cell containing genomic loss will count as 1) and droplet digital PCR (ddPCR) results (genomic loss will show no detection) for (A) MTAP and (B) CDKN2A, with line of linear regression in black [A: methylthioadenosine phosphorylase (MTAP): slope = 0.003411, y-intercept = 1.034011, R2 = 0.2404; B: CDKN2A: slope = 0.004099, y-intercept = 1.040047, R2 = 0.302].

