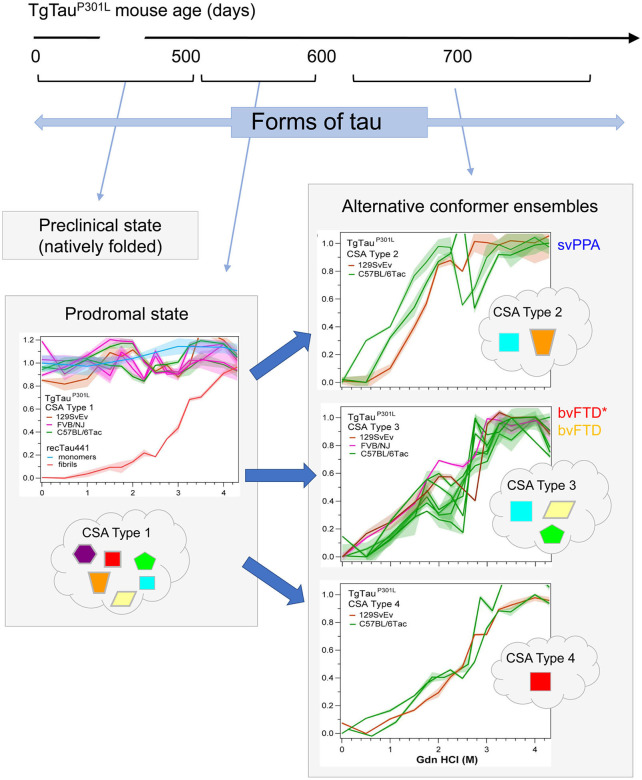
Figure 3.
Temporal evolution of conformer ensembles in the pathogenesis of a primary tauopathy. Conformers of protease-sensitive detergent-insoluble tau in TgTauP301L mice are represented by different geometric shapes [modified from (107)]. Different coexisting combinations (i.e., ensembles) of conformers corresponding to different CSA profiles are shown within the cloud outlines while the corresponding CSA traces of the samples are shown above these, with the y-axis representing Fapp values and the x-axis representing increasing Gdn HCl concentrations up to 4.5 M. Distinct CSA Types 2, 3, and 4 are present in the TgTauP301L mice; each curve represents dissociation and unfolding in one individual. Fapp values are plotted as mean ± SEM (shades) for each denaturant concentration and assayed in triplicate. Curve analysis was performed with non-linear regression and significance determined with generalized Wilcoxon test. Average ages (days ± SD) for CSA Types 1, 2, 3, and 4 were 535 ± 32, 649 ± 56, 629 ± 57, and 682 ± 82 days, respectively and for the types of fibrillar assemblies associated with the CSA profiles, see (107). CSA Types 2–4 are seen in mice with statistically indistinguishable average ages and hence likely represent alternative pathways of ensemble evolution (blue arrows). The closest equivalent human disease profiles to mouse CSA Types 2 and 3 are presented to the right of the CSA plots in the boxes with solid outlines; the initial clinical diagnoses assigned to these FTLD-MAPT-P301L cases are shown (svPPA, semantic variant of primary progressive aphasia; bvFTD, behavioral variant of FTD; bvFTD*, a bvFTD sub-variety). CSA indicates conformational stability assay; Fapp, indicates values of apparent fractional change.

