FIGURE 2.
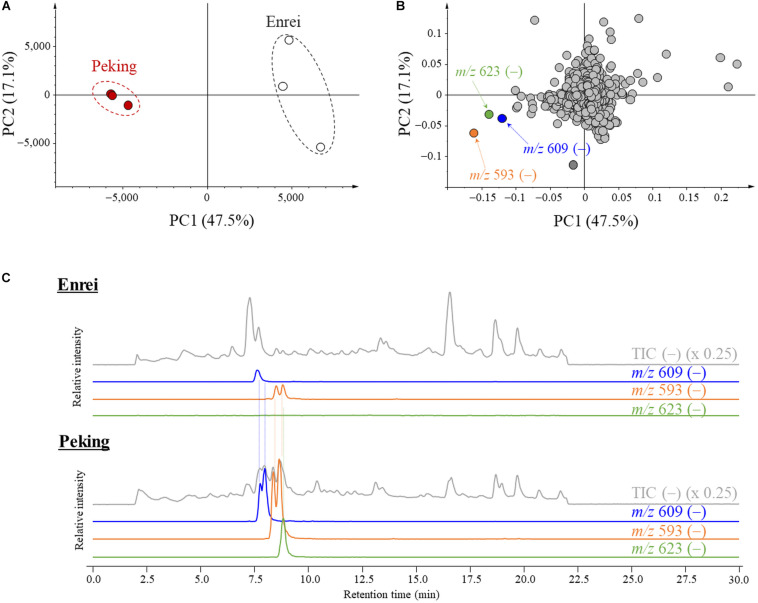
Principal component analysis (PCA) plots and liquid chromatography-mass spectrometry (LC-MS) chromatograms of metabolites isolated from Peking and Enrei. (A) PCA score plot. Red circles and white circles indicate Peking and Enrei, respectively (n = 3). (B) PCA loading plot. Components with large negative loading values are indicated by orange, green and blue circles. The m/z value and polarity of each component are described. (C) LC-MS chromatograms of Enrei and Peking leaf extracts. Total ion chromatograms (TIC) and extracted ion chromatograms (XIC) are described with the m/z value and the fold. Two peaks of m/z 609, two peaks of m/z 593 and one peak of m/z 623 were strongly detected in Peking.

