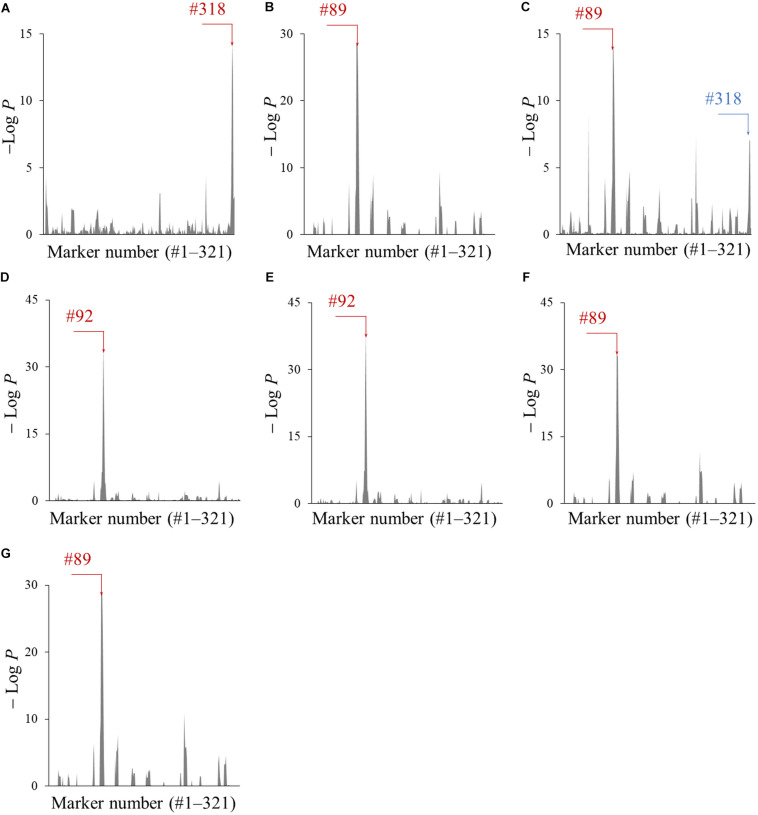
FIGURE 4.
The association of genomic segments of Peking with the amounts of metabolites A–G (A–G). The −LogP values obtained by the ANOVA was plotted against the corresponding 321 markers. The markers with the largest − LogP values are indicated with red arrows and the marker number (#). The marker which was associated with amounts of metabolite C is indicated by a blue arrow and the marker number (#).

