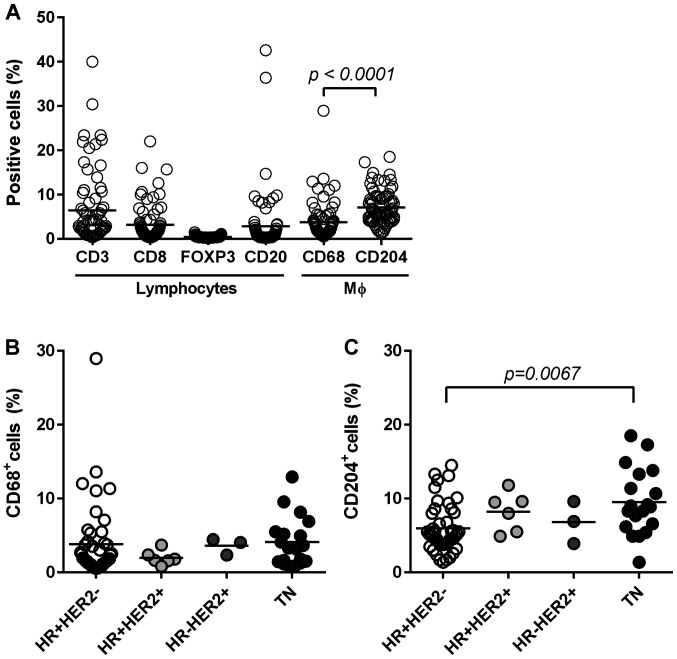
Figure 3.
Distribution of immune subsets. (A) Stained slides were digitalized and positive areas were counted using ImageJ software. The distribution of each subset (n=73) is shown. The distributions of (B) CD68+ macrophages, and (C) CD204+ macrophages are shown according to subtypes. Statistical analyses involved the Mann-Whitney U in (A) and the Kruskal-Wallis test in (C). Bars represent the mean value of each subset. HR, hormone receptor; TN, triple-negative.

