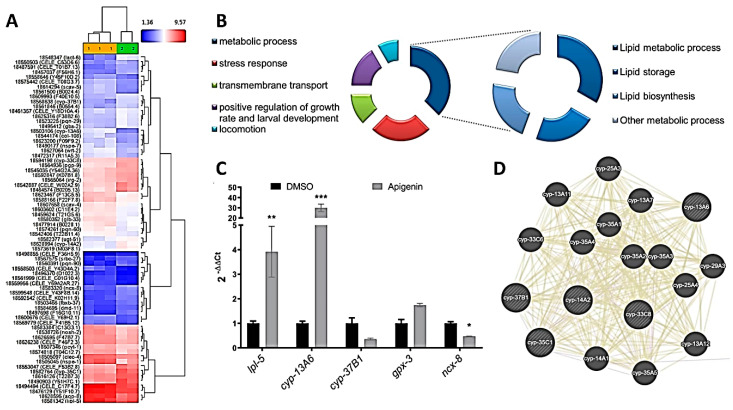
Figure 4.
Gene expression microarray comparison of apigenin (100 µM)-treated worms vs. DMSO control worms. (A) Hierarchical clustering analysis of apigenin (yellow) and DMSO (green) samples. (B) Gene Ontology biological processes enriched in apigenin-treated worms compared with DMSO control group. (C) qPCR analysis of genes differentially expressed in microarray analyses. Results are expressed as the fold difference expression levels of each gene in the apigenin-treated group compared with the DMSO control group, calculated with the 2−∆∆Ct method. Significance refers to the effect of resveratrol with respect to DMSO control worms (Wilcoxon test, * p < 0.05; ** p < 0.01; *** p < 0.001). (D) Interaction network obtained from GeneMANIA of the most related genes connected with cyp P450 observed after treatment with apigenin.

