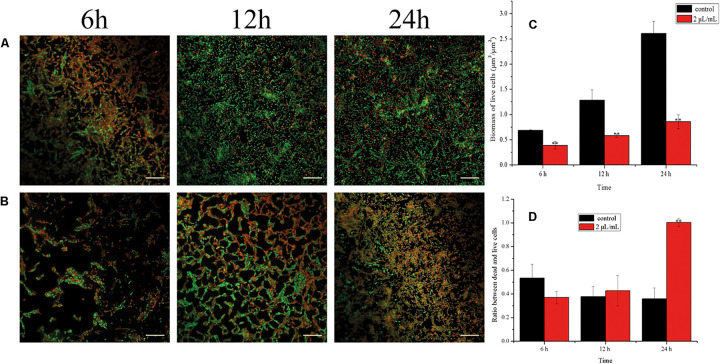
FIGURE 7.
Analyses of live/dead bacteria in E. coli ATCC 25922 biofilms: (A) Confocal laser scanning microscopy (CLSM) images of C. camphora essential oil (CCEO) at 0 μL/mL for 6, 12 and 24 h; (B) CLSM images of CCEO at 2 μL/mL for 6, 12 and 24 h; Green, live bacteria, red, dead bacteria; Images from three independent replicates with 20 μm bars are representative; (C) Biomass of live cells in bilfilm; (D) Ratio between dead and live cells in biofilm. A sample of 0 μL/mL CCEO was used as a control. Data represents the mean ± SD of three independent experiments, ** indicates p < 0.01 compared with the control at the same time.

