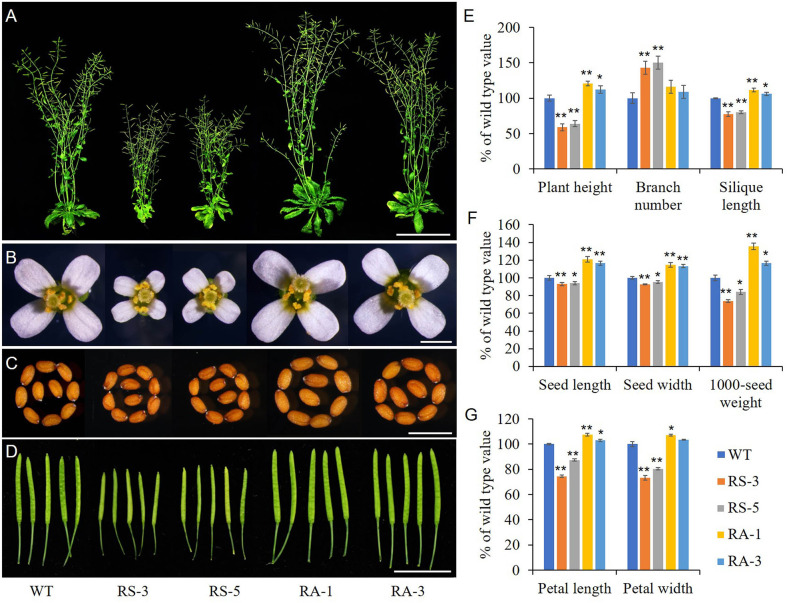
Figure 3.
Morphological analysis of the homozygous transgenic lines and wild type (WT). (A) Whole morphology. (B) Flowers. (C) Seeds. (D) Siliques. (E) Statistical analysis of plant height, branch number and silique length. (F) Statistical analysis of seed length, seed width and 1000-seed weight. (G) Statistical analysis of petal length and width. WT, wild type; RS-3 and RS-5, ZmRLK7 sense transgenic lines; RA-1 and RA-3, ZmRLK7 antisense transgenic lines. Values are means with SD relative to the respective wild-type values. * and ** denote significant differences at p < 0.05 and 0.01 by ANOVA, respectively. Bars = 10 cm for (A), 0.5 mm for (B, C) and 1 cm for (D).

