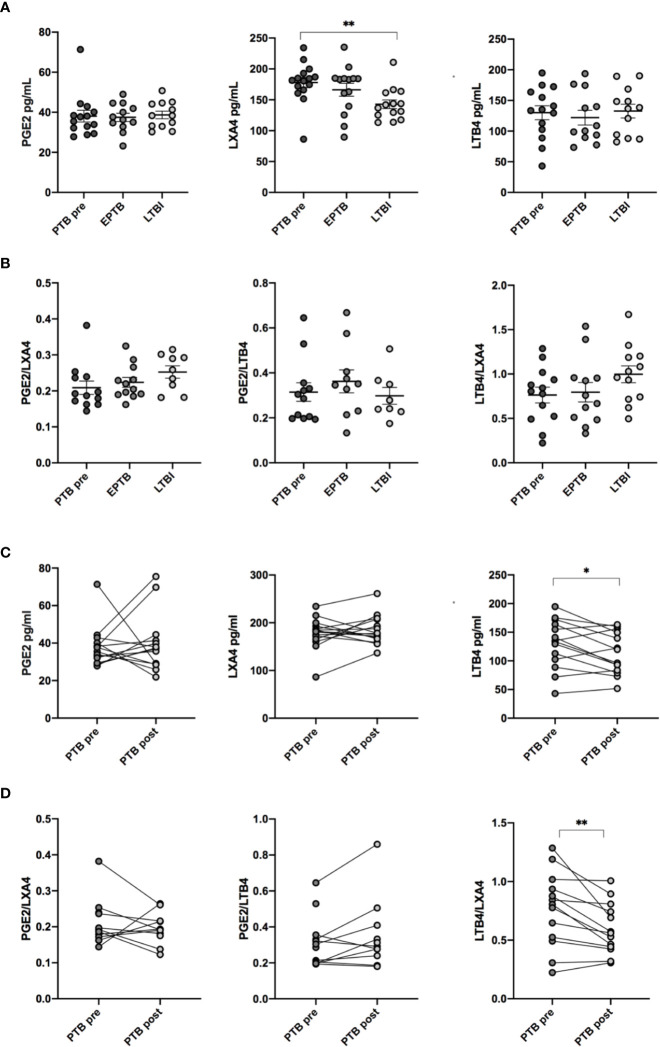
Figure 2.
Concentration and ratio of LXA4, PGE2 and LTB4 in plasma. (A) Concentrations of eicosanoid metabolites in pg/ml in plasma measured by ELISA at different stages of Mtb infection: EPTB (N = 14), PTB at time of diagnosis (PTB pre, N = 16), and LTBI (N = 17) (B) Ratio of eicosanoid metabolites in plasma in different stages of Mtb infection. (C) Levels of eicosanoid metabolites before (PTB pre, N = 16) and after treatment (PTB post, N = 16). (D) Ratios of eicosanoids before and after treatment. Data presented as median with interquartile ranges. P-values were calculated using the Kruskal-Wallis test with Dunn’s post-hoc for multiple comparisons and Wilcoxon signed rank test was used for paired samples. Statistical significance represented by asterisk: ns, not significant; *p < 0.05; **p < 0.01.

