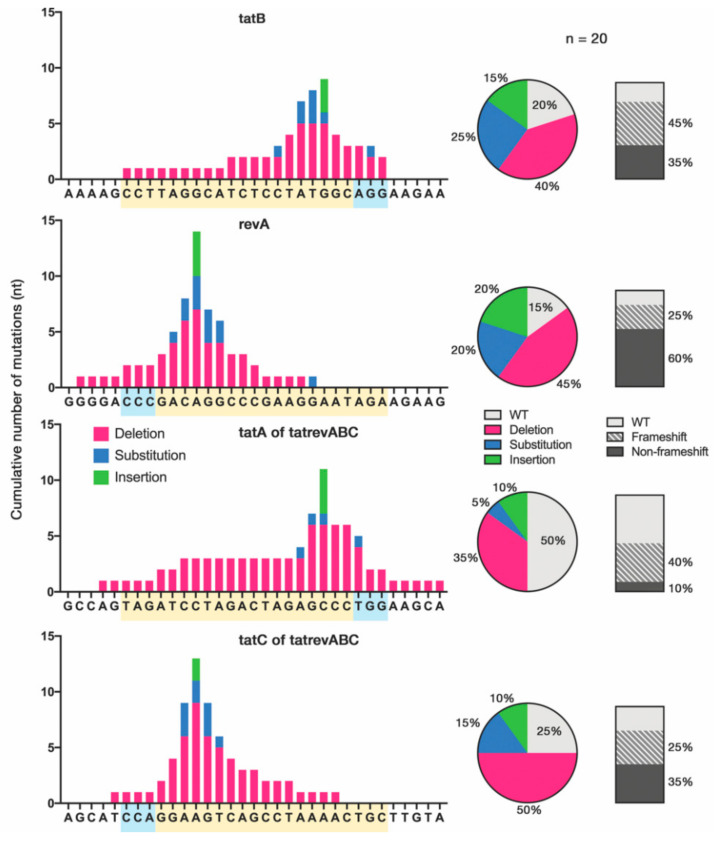
Figure 3.
Mutational pattern in gRNA-Cas9 target sites. On-target sites were amplified from cellular DNA of tatB, revA, and tatrevABC-transduced cell groups at 16 dpi. The tat and rev genes were amplified and TA-cloned to produce 20 samples for each target site, followed by Sanger sequencing. The cumulative number of mutations for each nucleotide is shown in the bar graph (left). Mixed substitutions with deletion or insertion were grouped as deletion or insertion, respectively. Yellow boxes indicate the gRNA sequence, and blue boxes indicate the PAM site. The proportion of mutation types and frameshift mutations for each gRNA are shown by the pie charts and vertical slices, respectively.

