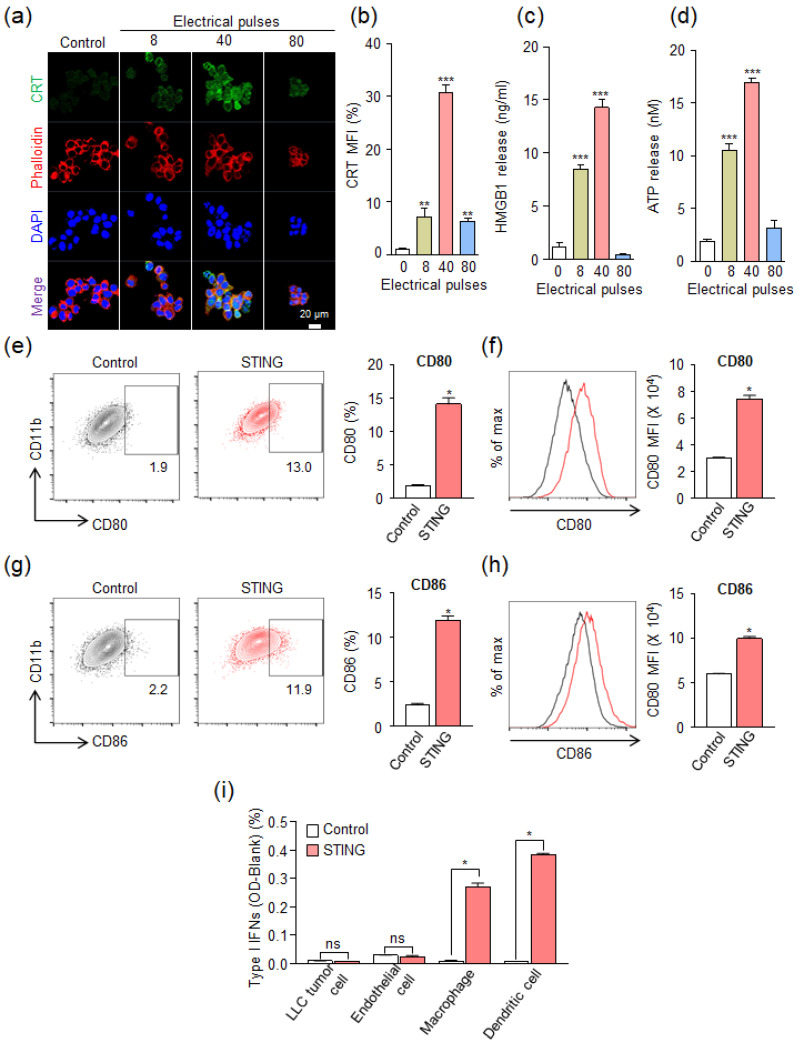
Figure 3.
In vitro immunogenic cell death (ICD) was induced by irreversible electroporation (IRE). (a) Expression of calreticulin (CRT) on the surface of the LLC after IRE under various electrical pulses at a voltage of 1000 V. Confocal microscopy images were obtained 24 h after IRE. (b) Quantitative analysis of CRT expression levels in the confocal microscopy results compared to the control group (** p < 0.01, *** p < 0.0001). (c) Amount of released HMGB1 from LLC at 24 h after IRE under various electrical pulses at a voltage of 1000 V (*** p < 0.0001). (d) Amount of release ATP from LLC immediately after IRE under various electrical pulses at a voltage of 1000 V (*** p < 0.0001). (e–h) Flow cytometry analysis of the murine myeloid cells (RAW264.7) at 24 h after treatment STING agonist (RR-CDA, 10 μg/mL). Representative flow cytometric plots and quantitative analysis of (e and f) CD80+ and (g and h) CD86+ cells (* p < 0.05). (i) Type-I IFNs activation after STING agonist treatment (RR-CDA, 10 μg/mL) in various cell types. In Figure 3e–i, control means a non-treated group. Pooled data from two independent experiments with n = 5 per group. Values are mean ± SD. Two-tailed Student t test.

