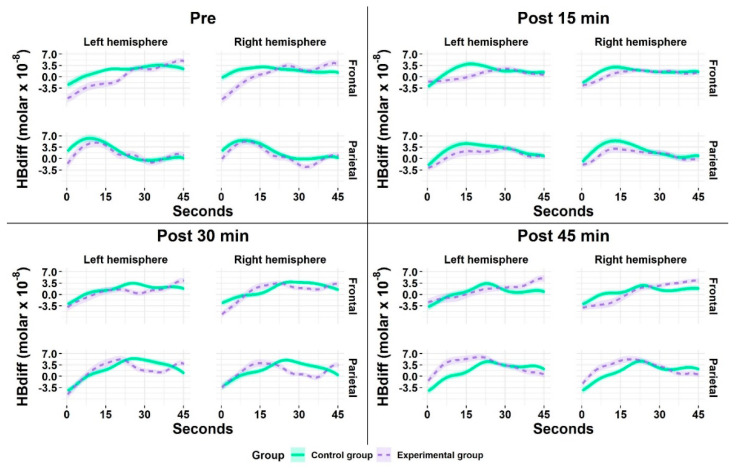
Figure 7.
Mean cortical hemodynamic activity as measured by HBdiff during the 2-back task for the experimental (EG) and control group (CG) at the time point pre (baseline) and at the follow-up measurements after the acute exercise intervention (EG) or listening to the audiobook (CG), respectively. All values are given as mean (M); the colored frames on the curves correspond to one standard error (SE) of the mean.

