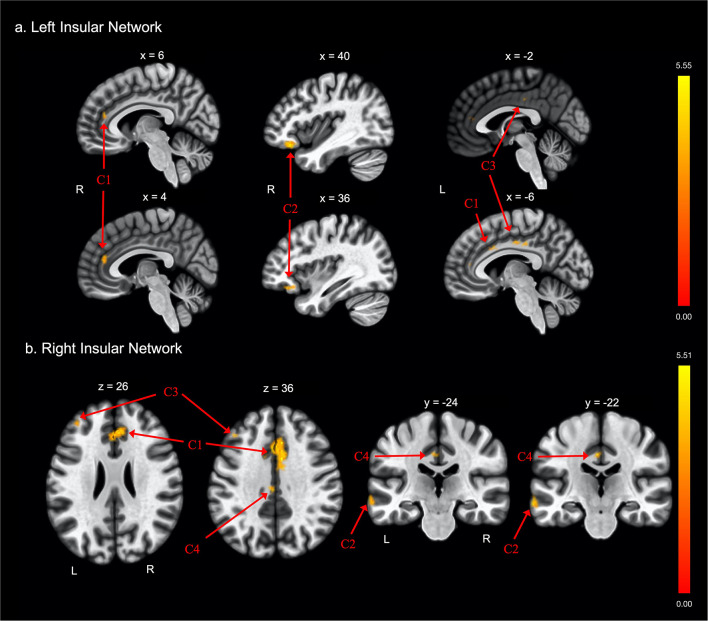
Figure 2.
Group differences in functional connectivity with the (A) left insula and (B) right insula ROIs, after adjusting for age, education, sex, and global cognition. Clusters corrected for multiple comparisons using a false discovery rate (FDR)-corrected threshold of p < 0.05 (voxel p < 0.005), two-tailed. Values shown in the color bar correspond to t-scores. Negative (blue) clusters reflect those with significantly greater connectivity to the ROI in perceived FE compared to non-FE older adults; positive (red) clusters reflect those with significantly less connectivity to the ROI in perceived FE compared to non-FE older adults.

