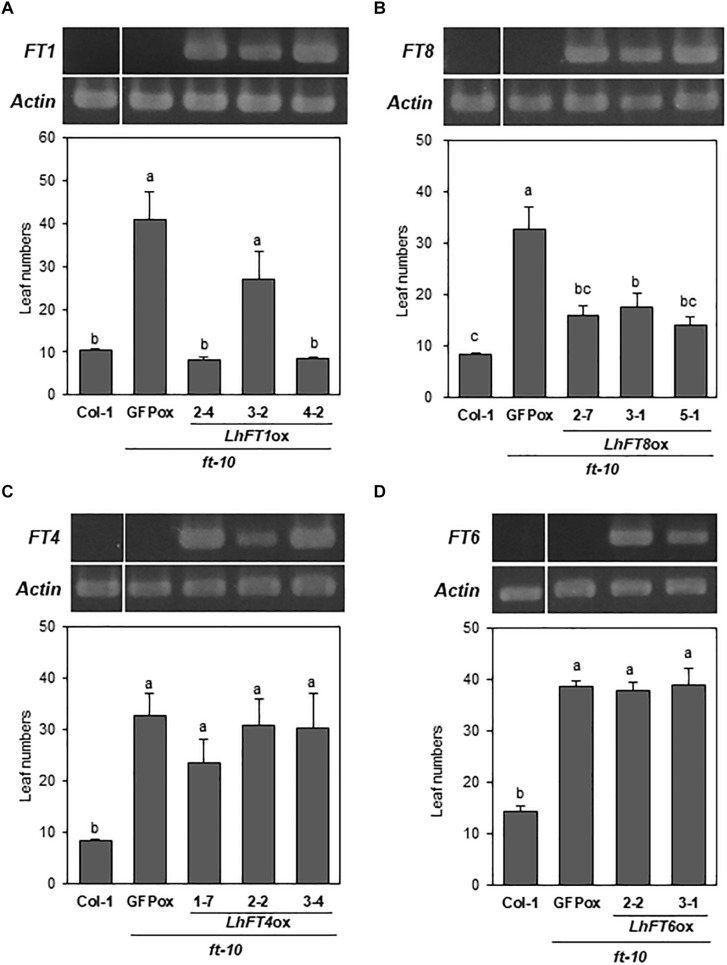
FIGURE 6.
Flowering time phenotypes of the lines overexpressing LhFT genes in the Arabidopsis ft-10 mutant. (A) LhFT1-overexpressing transgenic plants. (B) LhFT8-overexpressing transgenic plants. (C) LhFT4-overexpressing transgenic plants. (D) LhFT6-overexpressing transgenic plants. All transgenic plants are T2 homozygous specimens. Col-1 represents the wild-type. GFP indicates the vector control transgenic plants in the Arabidopsis ft-10 background. RT-PCR analysis was performed to investigate the expression levels of transgenes and AtACT2 (internal standard). The number of leaves in transgenic lines overexpressing each LhFT gene was investigated in 10 individuals of two or three independent lines during bolting. Values are expressed as the mean ± SE (n = 10). The different letters placed above columns are significantly different according to the Tukey–Kramer test (P < 0.05).

