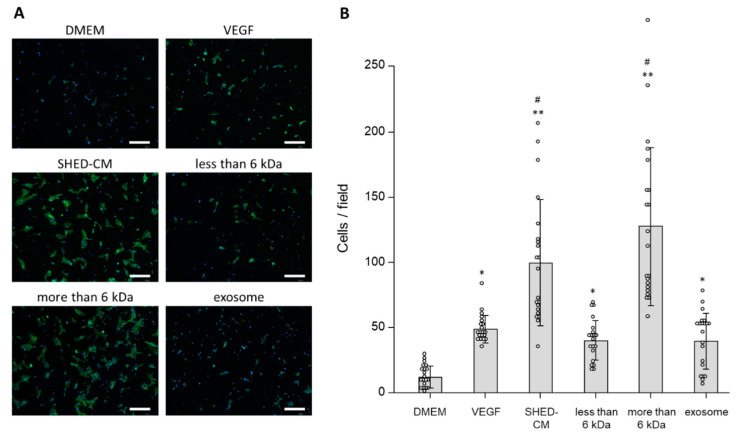
Figure 3.
Boyden chamber assays were performed to assess HUVEC migration. (A) Representative images show HUVECs on the lower surface of the chamber. HUVECs were stained with phalloidin (green) and nuclei with 4′,6-diamidino-2′-phenylindole dihydrochloride (DAPI) (blue). HUVECs were incubated with VEGF (19.1 ng/mL), SHED-CM, the <6 kDa fraction, >6 kDa fraction, exosomes, or DMEM for 12 h (n = 3). Scale bar = 200 μm. (B) Numbers of cells that migrated to the lower surface of the chamber. * p < 0.05 vs. DMEM, ** p < 0.01 vs. DMEM, # p < 0.05 vs. VEGF.

