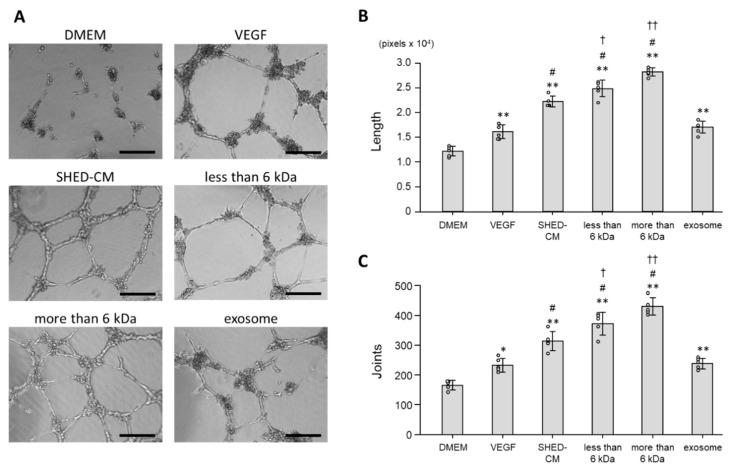
Figure 5.
Tube formation assays were performed to assess HUVEC differentiation into tube-like structures. (A) Representative images show tube-like structures of HUVECs that were cultured for 12 h in the presence of VEGF (19.1 ng/mL), SHED-CM, the <6 kDa fraction, >6 kDa fraction, exosomes, or DMEM (n = 5). Scale bar = 200 μm. (B) Total tube lengths. (C) Numbers of joints. * p < 0.05 vs. DMEM, ** p < 0.01 vs. DMEM, # p < 0.05 vs. VEGF, † p < 0.05 vs. SHED-CM, †† p < 0.01 vs. SHED-CM.

