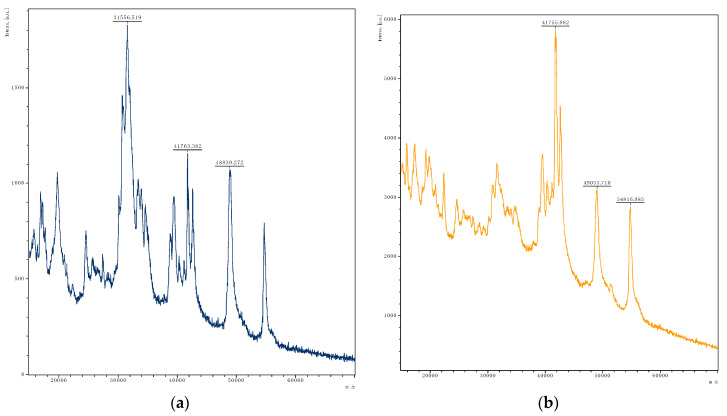
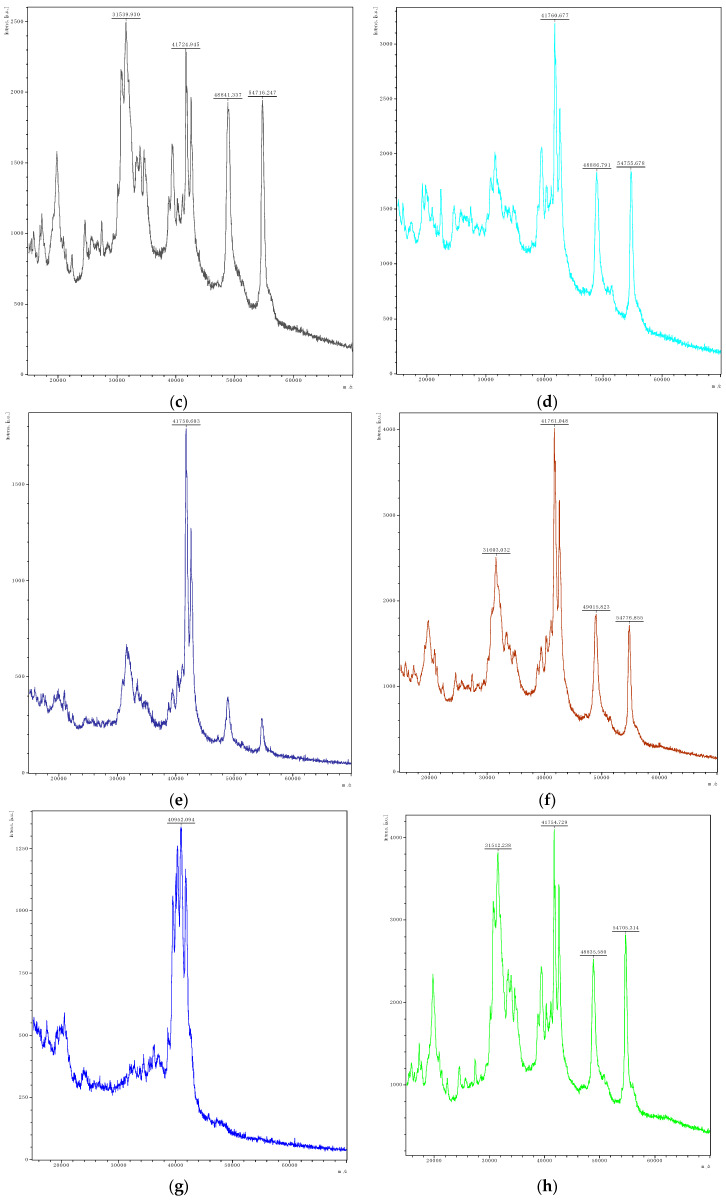
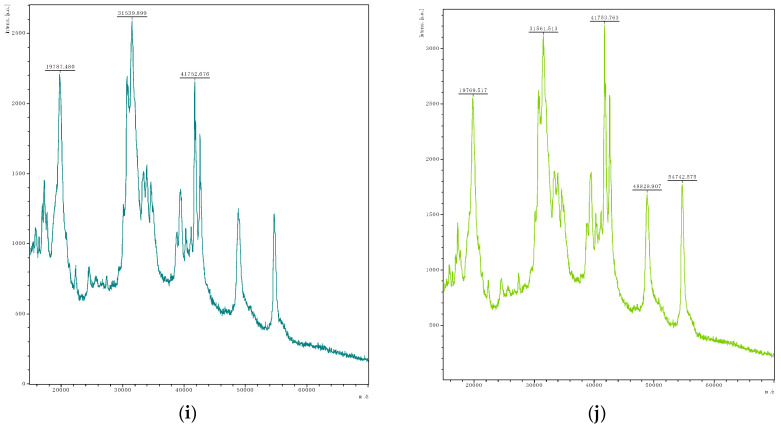
Figure 2.
MALDI-TOF MS spectra of gliadins in the mass to charge (m/z) range of 15 to 70 kDa of (a) reference and after the degradation (72 h, 30 °C) by (b) Levilactobacillus brevis Lb3, (c) Latilactobacillus curvatus Lcu4, (d) Loigolactobacillus coryniformis Lco4, (e) Lactiplantibacillus plantarum Lpl5, (f) Lp. plantarum Lpl7, (g) Lacticaseibacillus paracasei Lpa4, (h) Leuconostoc pseudomesenteroides Leps1, (i) Pediococcus pentosaceus Pp3, (j) Lc. mesenteroides Lm3.


