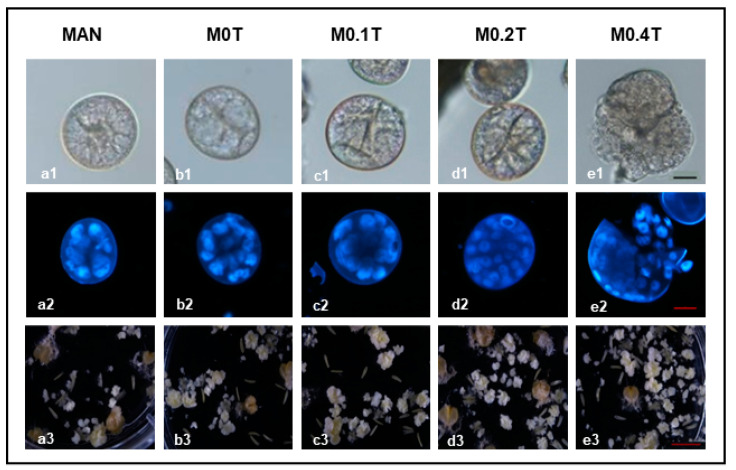
Figure 1.
Microspore embryogenesis of bread wheat after the application of different concentrations of trichostatin A (TSA) simultaneously with mannitol stress treatment. Multicellular structures (enclosed by the exine) and proembryos (multicellular structures released from the exine) (a1–e1 and a2–e2) at 10 days of culture and mature embryos and callus-like structures (a3–e3) at 40 days of culture from cv. Pavon. a1–e1: bright field images; a2–e2: dark field images of multicellular structures and proembryos stained with DAPI. a1–a3) MAN = 0.7 M mannitol; b1–b3) M0T = 0.7 M mannitol with 1% DMSO; c1–c3) M0.1T = mannitol with 0.1 µM TSA; d1–d3) M02T = mannitol with 0.2 µMTSA; e1–e3) M0.4T = mannitol with 0.4 µMTSA. Scale bars for a1–e1 and a2–e2 = 20 µM; scale bars for a3–e3 = 2.5 mm.

