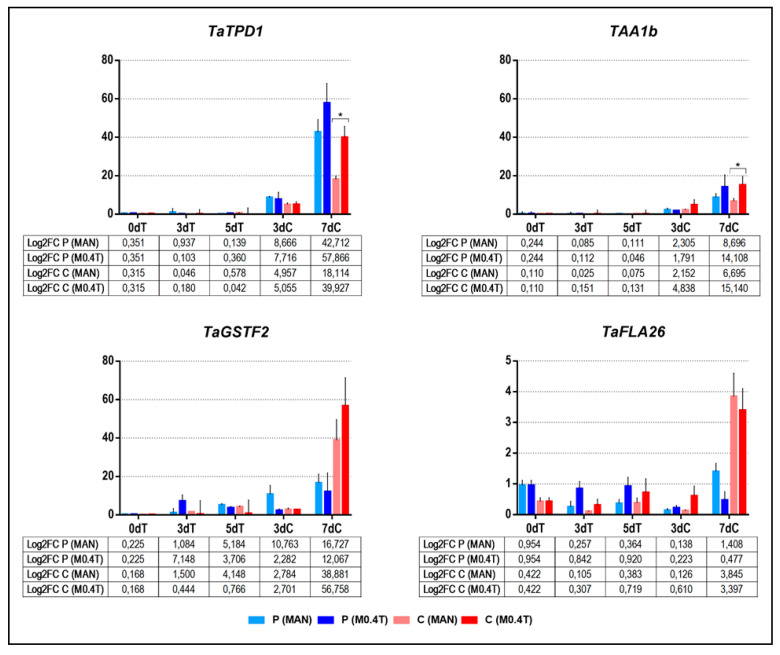
Figure 4.
qRT-PCR analysis of early (TaTPD1, TAA1b and TaGSTF2) and middle (TaFLA26) marker genes for bread wheat microspore embryogenesis after application of treatments with 0.7 M mannitol (MAN) and mannitol with 0.4 µM TSA (M0.4T) in cvs. Pavon (P) and Caramba (C) after 0, 3, and 5 days of treatment (0dT, 3dT, and 5dT) and 3 and 7 days of culture (3dC and 7dC). The y-axis shows the log2 fold-change when the data was normalized using Ta27771 as endogenous gene control. Error bars represent the standard error of the means. Asterisk indicates significant differences between treatments for each cultivar, according to a Student´s t-test (p ˂ 0.05).

