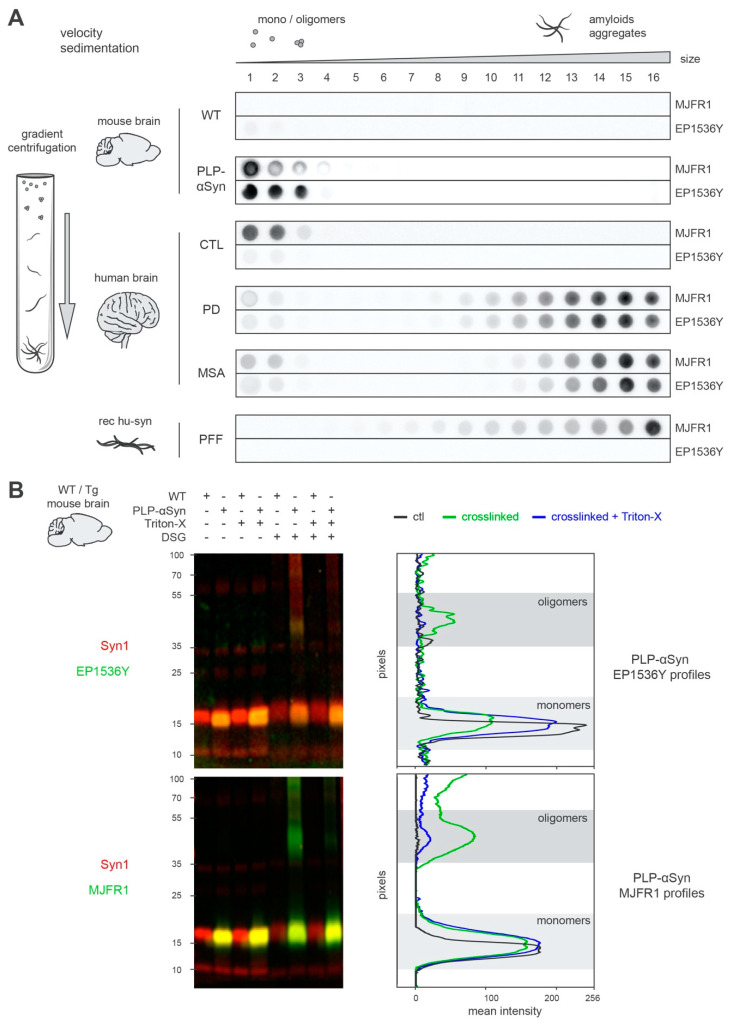
Figure 2.
Unlike in MSA and PD, S129-phosphorylated human α-syn is oligomeric and monomeric in PLP-αSyn mouse brains. (A) Aggregation profiles obtained by sedimentation of the different species of α-syn found in WT or PLP-αSyn mouse brains (top), control, PD and MSA human subject brains (middle) or a preparation of recombinant human α-syn PFF (bottom). Pooled mouse (n = 3) or human (n = 3) brain homogenates and PFF samples were subjected to SarkoSpin solubilization followed with fractionation by sedimentation velocity upon ultracentrifugation on iodixanol gradient. The distribution of human α-syn (MJFR1) and pS129-α-syn (EP1536Y) was analyzed by filter trap on the collected fractions (numbered from top to bottom of gradient) followed by immunostaining with the respective antibodies. Pictures are representative of n = 3 independent sedimentations quantified in Supplementary Figure S2. (B) Representative western blot pictures (left) and their intensity quantification (right) of WT/PLP-αSyn mouse brains samples. Cytosolic fractions from pooled 9 months-old WT (n = 3) or age-matched PLP-αSyn (n = 3) brain homogenates were treated or not with Triton-X (0.25%, 30 min on ice) followed by crosslinking or not with DSG (2 mM, room temperature). These samples were subjected to SDS-PAGE electrophoresis and immunoblotted with couples of antibodies directed against total α-syn (syn1, red) and pS129-α-syn (EP1536Y, green, top) or human α-syn (MJFR1, green, bottom) using infrared dyes labelled secondary antibodies. Signal intensity of pS129-α-syn (top) and human α-syn (bottom) were quantified vertically by line scanning for PLP-αSyn samples untreated (black), DSG-crosslinked (green) or with prior Triton-X treatment (blue). Monomeric (light) and oligomeric (dark) species of the two forms of the proteins are depicted with the grey zones.

