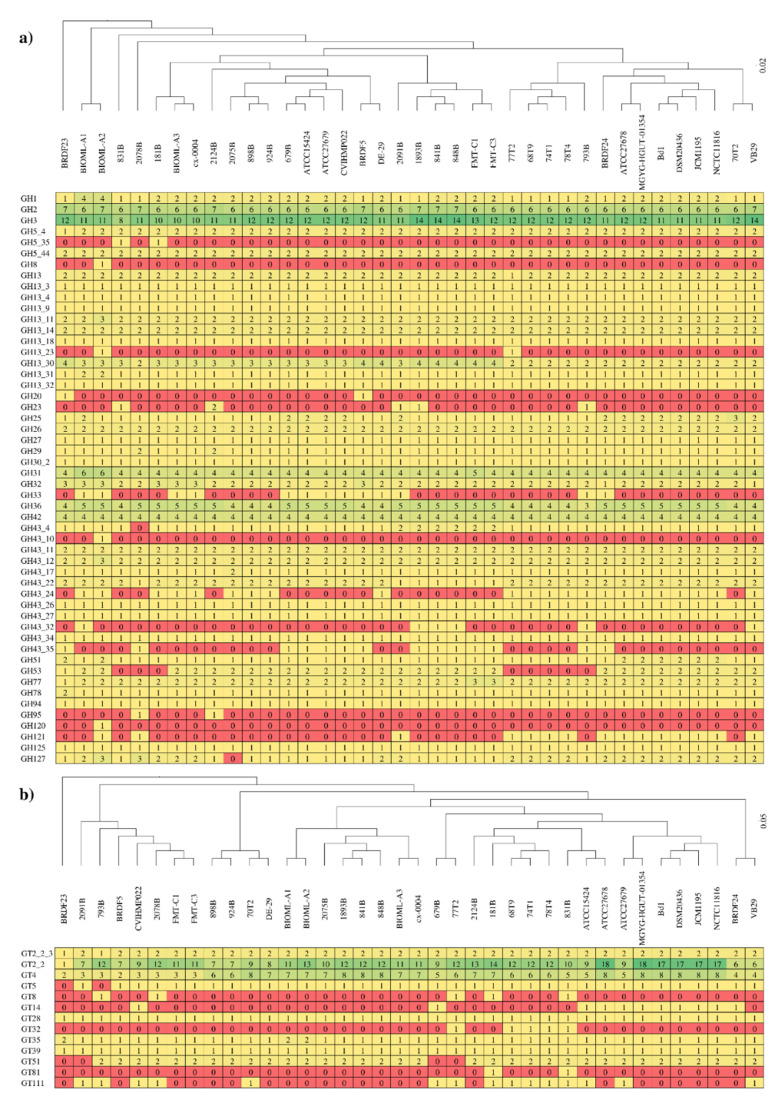
Figure 3.
Carbohydrate-active enzymes of the B. dentium taxon: (a) displays a heat map of the glycosyl hydrolases (GHs) prediction among 38 B. dentium strains analyzed, while (b) exhibits a heat map of the predicted glycosyltransferases (GTs) of the same genomes. Colors reflect the abundance of the identified genes, starting from zero (red) to 18 (green). On top of both panels, hierarchical clustering is reported based on the identified GH and GT families retrieved in each strain.

