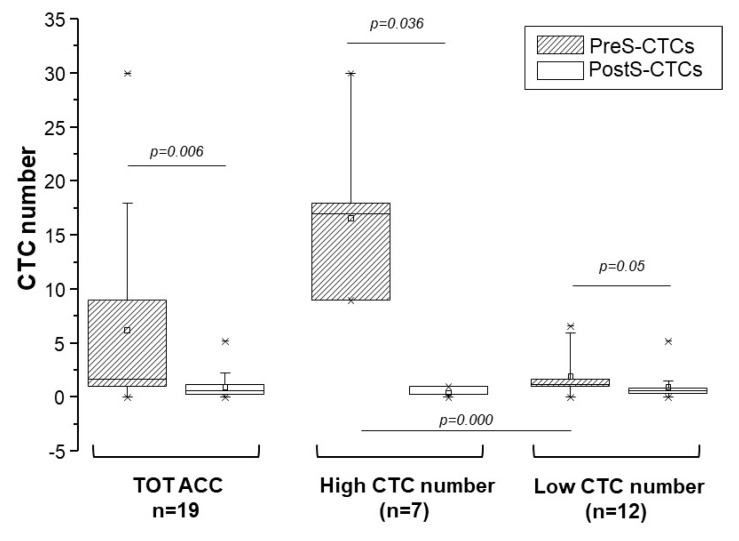
Figure 2.
CTC distribution in pre-surgery and post-surgery blood samples in ACC patients. Box charts indicate CTC number distribution between pre-surgery (PreS-CTCs) and post-surgery (PostS-CTCs) blood samples in the entire cohort of ACC patients (TOT ACC), and when the cohort was stratified in low and high CTC number in PreS blood samples classes according to the cut off of 9 CTCs (75th percentile of the non-parametric distributions of PreS CTCs). For each patient, when multiple samples were available, the median number of CTC was used for the analysis; * the lowest and the highest values for each group are indicated. As paired PreS and PostS samples were not available for all patients, differences between the two groups of data were analyzed by the Mann–Whitney U test for independent non-parametric data, the resulting p values are indicated.

