Figure 2.
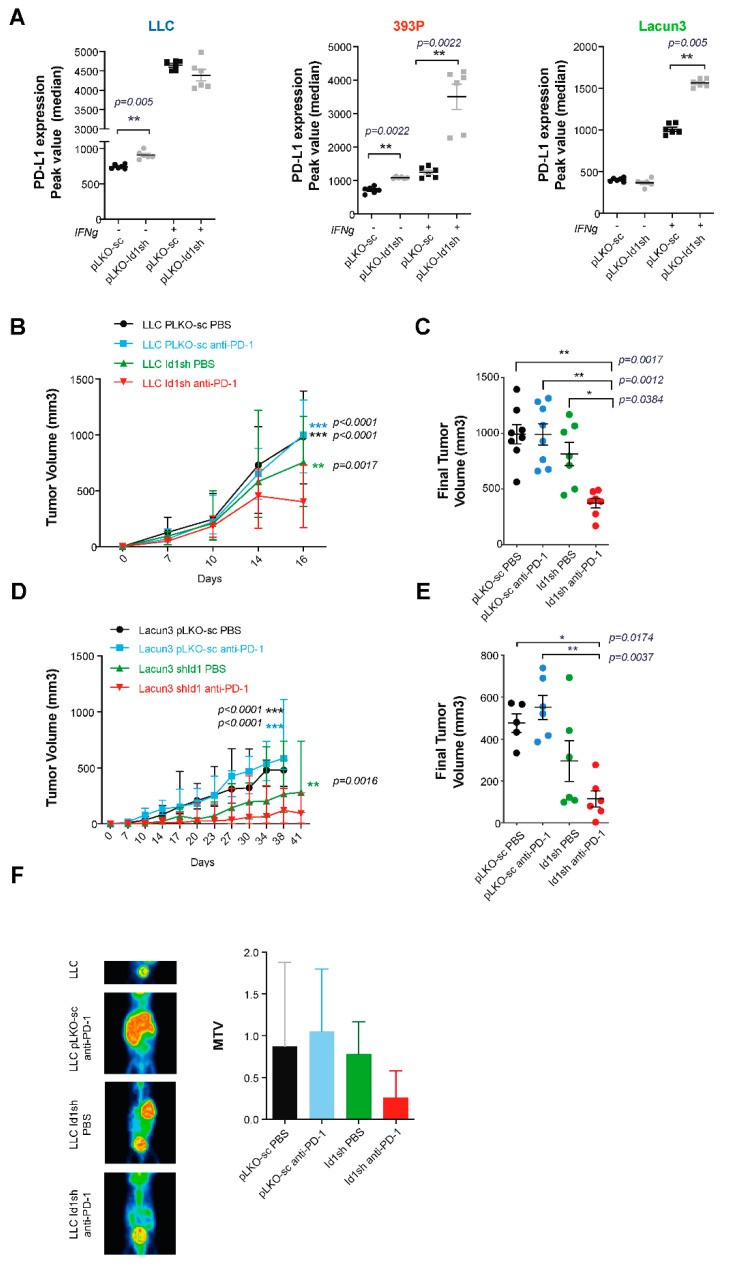
Silencing Id1 gene in murine LUAD cell lines induce PD-L1 expression in vitro and potentiates the antitumor activity of PD-1 blockade in a mouse model. (A) Flow cytometry analysis showed a statistically significant increase in PD-L1 expression when LLC, 393P and Lacun3 tumor cells had Id1 inhibited, in some cases after exposure to IFN-γ for 24 hours (Median of peak value: LLC -IFN-γ: pLKO-sc 737 [717–778], Id1sh 895 [875.3–953.5], p = 0.005); 393P -IFN-γ: pLKO-sc 729 [624.8–791.3], Id1sh 1076 [1059–1115], p = 0.0022; 393P +IFN-γ: pLKO-sc 1252 [1087–1394], Id1sh 3990 [2336 – 4184], p = 0.0022; Lacun3 +IFN-γ: pLKO-sc 989 [962.5–1085], Id1sh 1556 [1523–1617], p = 0.005). Results are represented as the average of three independent experiments. (B) Inhibition of Id1 in LLC cells along with anti-PD-1 treatment impairs tumor growth in vivo in a syngeneic model of LUAD using C57BL/6J mice. (C) Final tumor volumes of the same four mice groups as in B at day 16 post-tumor injection (Id1sh/anti-PD-1: 388.8 [277.1–476.3] mm3; Id1sh/DPBS: 795.5 [499.4–1067] mm3, p = 0.0384; pLKOsc/anti-PD-1: 1002 [698.8–1267] mm3 p = 0.0012; pLKOsc/DPBS: 982.6 [869.4–1164] mm3, p = 0.0017). (D) Inhibition of Id1 in Lacun3 cells along with anti-PD-1 treatment impairs tumor growth in vivo in a syngeneic model of LUAD using Balb/c mice. (E) Final tumor volumes of the same four mice groups as in D at days 38 (mice injected with Lacun3 pLKO-sc) and 41 (mice injected with Id1sh-Lacun3) post-tumor injection (Id1sh/anti-PD-1: 93.26 [43.82–192.4] mm3; Id1sh/DPBS: 218.1 [105.8–504.4] mm3, n.s.; pLKO/anti-PD-1: 537.8 [410.2–701.8] mm3, p = 0.0037; pLKO/DPBS: 481 [383.9–568.4] mm3, p = 0.0174). (F) Representative mPET images of 18F-FDG uptake in LLC (pLKO-sc or Id1sh) tumor-bearing C57BL/6J mice 3 weeks after intrasplenic tumor cell inoculation. Total metabolic tumor volumes (MTV) were quantified for each group and plotted (Id1sh/anti-PD-1: 0.26 [0–0.88]; Id1sh/DPBS: 0.69 [0.24–1.08]; pLKO/anti-PD-1: 0.57 [0.28–1.54]; pLKO/DPBS: 0.46 [0.23–1.93], p > 0.05). The data are reported as the median with the interquartile range. * p < 0.05, ** p < 0.01, *** p < 0.001.

