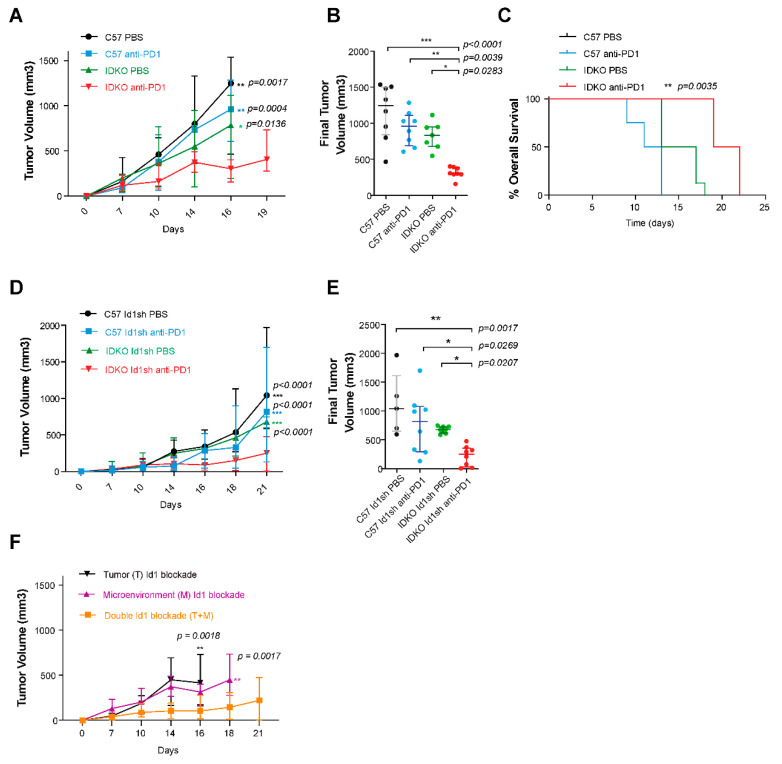
Figure 3.
Effect of combined PD-1 and Id1 blockade in both tumor microenvironment (IDKO mice) and tumor microenvironment along with tumor cells (LLC) in a LUAD syngeneic model. (A) Tumor growth LLC parental cells injected in Id1+/+ (C57BL/6J) or Id1-/- (IDKO) mice. (B) Final tumor volumes of the same four mice groups as in A at days 16 and 19 (IDKO mice injected treated with anti-PD-1 therapy) post-tumor injection (Id1-/-/anti-PD-1: 303.1 [291–387.8] mm3; Id1-/-/DPBS: 834.6 [678.1–961.1] mm3, p = 0.0283; Id1+/+/anti-PD-1: 961.1 [686.7–1112 ] mm3, p = 0.0039; Id1+/+/DPBS: 1248 [839.3–1502] mm3, p < 0.0001). (C) Kaplan-Meier plot of the OS of mice in A (median survival per group in days: Id1-/-/anti-PD-1: 20.5; Id1-/-/DPBS: 15; Id1+/+/anti-PD-1: 12; Id1+/+/DPBS: 11; p = 0.0035). (D) Combined blockade of PD-1 and Id1 silencing both in the tumor microenvironment (IDKO mice) and LLC cells significantly decreases tumor proliferation. (E) Final tumor volumes of the same four mouse groups as in D at day 21 post-tumor injection (Id1-/-/anti-PD-1: 250.7 [30.34–357.4] mm3; Id1-/-/DPBS: 679.8 [617.4–728.2] mm3, p = 0.0207; Id1+/+/anti-PD-1: 817.5 [296.6–1077] mm3, p = 0.0269; Id1+/+/DPBS: 1043 [649–1613] mm3, p = 0.0017). *** p < 0.001. (F) Comparison of tumor growth of the three murine models injected with the LLC cell line (Tumor Id1 blockade (T), Microenvironment Id1 blockade (M) and double Id1 blockade (T + M)) and treated with anti-PD-1 therapy. The data are reported as the median with the interquartile range. * p < 0.05, ** p < 0.01.

