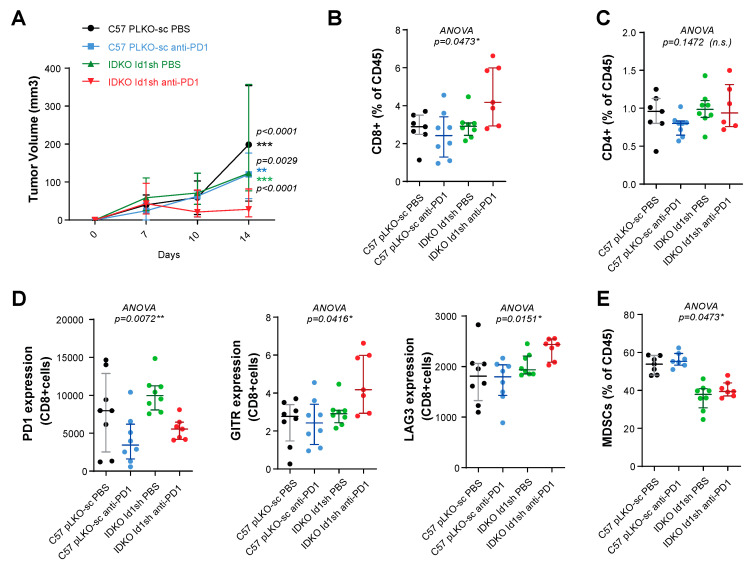
Figure 6.
The antitumor activity observed after the Id1 and PD-1 blockade is mediated by CD8+ T cells. (A) Tumor growth of LLC (pLKO-sc or Id1sh) cells in mice (C57BL/6J or IDKO) treated with DPBS or anti-PD-1 for endpoint flow cytometry analysis (final tumor volume per group: Id1-/-/anti-PD-1: 28.04 [21.42–65.61] mm3; Id1-/-/DPBS: 123.3 [82.24–227.2] mm3, p < 0.0001; Id1+/+/anti-PD-1: 120.3 [70.97–148.1] mm3, p = 0.0029; Id1+/+/DPBS: 198.4 [122.6–223.8] mm3, p < 0.0001). (B) Flow-cytometric analysis of CD8+ T cells in tumors harvested at day 14. (C) Flow-cytometric analysis of CD4+ T cells in tumors harvested at day 14. (D) Flow-cytometric analysis of PD-1, GITR and LAG3 markers (expressed as mean fluorescence intensity on CD8+ T cells) in LLC tumor grown the same mice as in A. (E) Flow-cytometric analysis of MDSCs cells in tumors harvested at day 14. The data are reported as the median with the interquartile range. * p < 0.05, ** p < 0.01, *** p < 0.001, n.s. (not significant).

