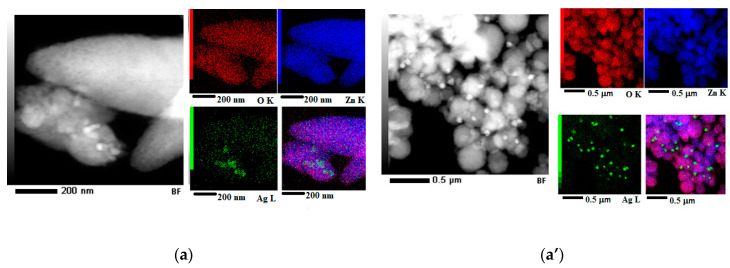
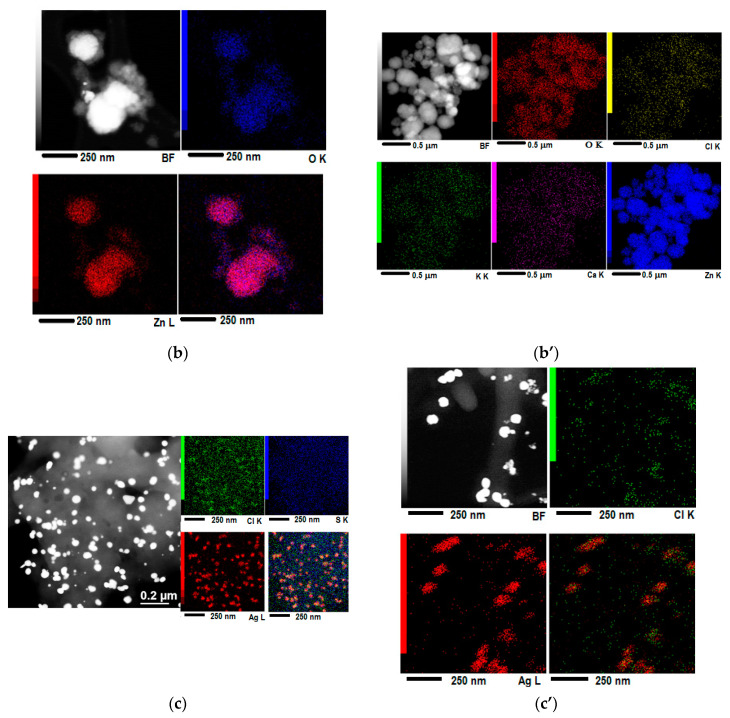
Figure 4.
HAADF-STEM image at low magnification and elementary maps obtained by EDS mapping corresponding to the HAADF-STEM image, for (a) AgZnO-CUI (Ag L—green, Zn K—blue and O K—red), (b) ZnO-CUI (Zn K—red and O K—blue), (c) Ag-CUI (Ag L—red, Cl K—green, S K—blue), (a’) AgZnO-MAND (Ag L—green, Zn K—blue and O K—red), (b’) ZnO-MAND (O K—red, Cl K—yellow, K K—green, Ca K—purple and Zn K—blue) and (c’) Ag-MAND (Ag L—red and Cl K—green). For each sample, the last image was obtained by overlapping the individual elemental maps.


