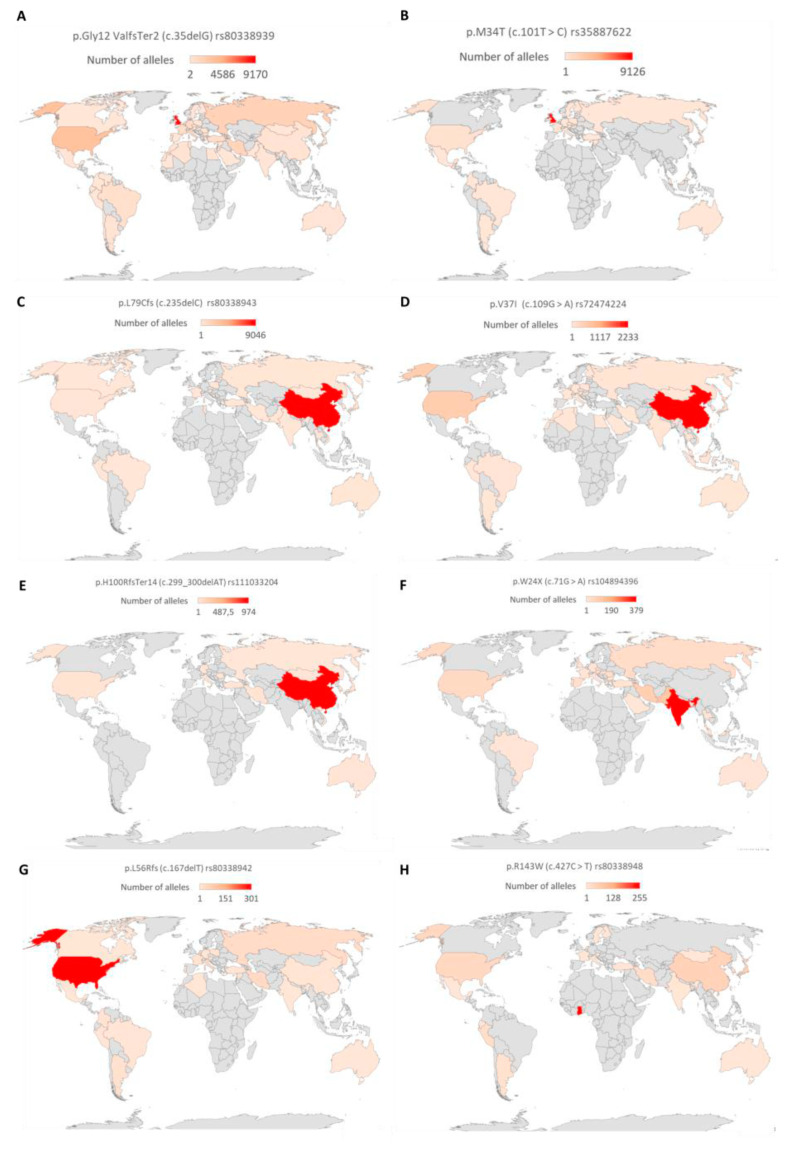
Figure 4.
Global distribution of common GJB2 variants. A graph showing the total number of reported alleles of (A) p.Gly12ValfsTer2 (c.35delG), (B) p.M34T (c.101T > C), (C) p.L79Cfs/c.235delC, (D) p.V37I/c.109G > A, (E) p.H100RfsTer14/c.299_300delAT, (F) p.W24X/c.71G > A, (G) p.L56Rfs/c.167delT, and (H) p.R143W/c.427C > T. The countries were colored with a gradient from red (highest number of alleles) to brown (lowest number of alleles). Countries shaded grey either had no reports or no alleles. The map was created by the authors in Microsoft Excel (Office 365 education license of the University of Cape Town, South Africa).

