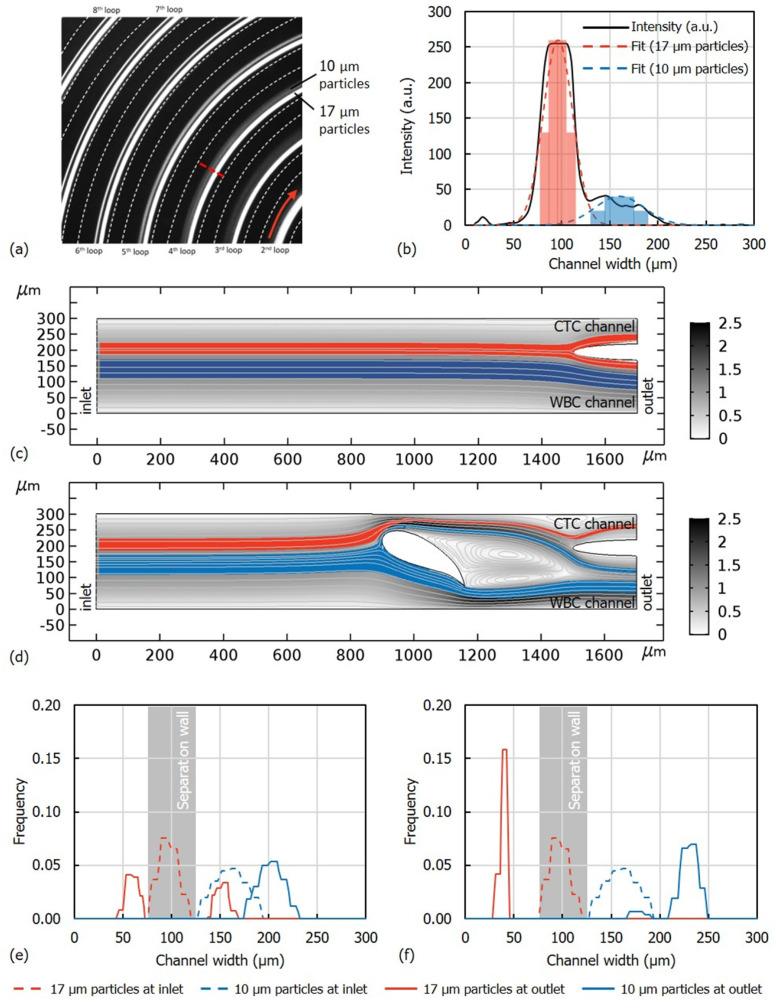
Figure 2.
(a) Focusing of 10 µm and 17 µm fluorescent beads in a spiral channel with 8 loops. (b) Grayscale intensity profile of the beads across the channel at the 4th loop. Solid line denotes the measured intensity. Dash lines denote the Gaussian curves fitted to the intensity profile, to represent the individual distributions of the beads. Pale red and pale blue shaded regions denote the discretized distribution of the particles, as the input to the simulation model. Velocity field and the trajectories of the particles in the channel at the downstream of the spiral (Figure 1) (c) in the absence of the hydrofoil and (d) in the presence of the hydrofoil. Red and blue streams represent 17 µm and 10 µm particles, respectively. The scale bar indicates the flow velocity in m/s. Distribution of 10 µm and 17 µm particles at the inlet and the outlet (e) in the absence of the hydrofoil and (f) in the presence of the hydrofoil. The resolution at the upstream Ru = 2.24 was increased to the resolution at the downstream Rd = 30.46, which shows the effect of using hydrofoil to enhance separation.

