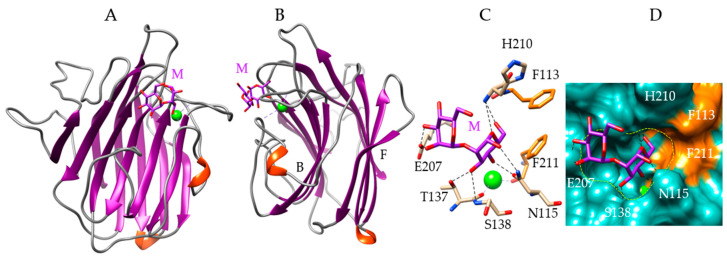
Figure 3.
Molecular modeling of Porphyra umbilicalis lectin. (A,B) Back face (A) and lateral view (B) of the ribbon diagram of the modeled Porphyra umbilicalis lectin (PUL) in complex with a dimannoside Manα1,2Man (M, colored purple). The calcium ion is colored green. The front (F) and back (B) faces of the β-sandwich are indicated in B. (C) Network of hydrogen bonds (black dashed lines) anchoring the dimannoside Manα1,2Man (M) to the amino acid residues forming the CBS of the PUL. Aromatic residues F113 and F211 interacting with the dimannoside by stacking interactions, are colored orange. (D) Molecular surface (colored slate green) at the CBS of PUL forming a depression (delineated by a yellow dashed line) harboring the dimannoside (M, colored purple) linked by a network of hydrogen bonds (black dashed lines) to N115, T137, S138, E207, and H210 residues, and stacking interactions with F113 and F211 residues (colored orange). The calcium ion is colored green.

