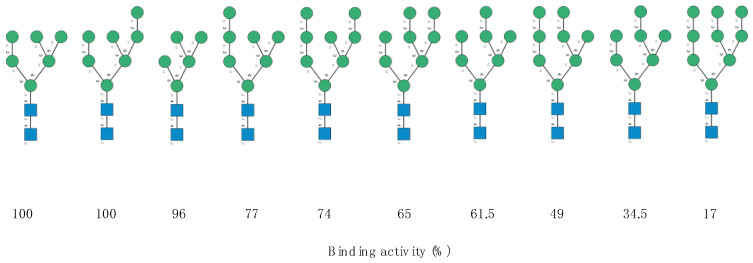
Figure 7.
Structure of the high-mannose type N-glycans assayed by Sato et al. (2011) to measure the oligosaccharide-binding specificity of KAA-2 from the red alga Kappaphycus avalvarezii. The high-mannose N-glycans are aligned according to their decreasing binding activity (expressed as %) towards KAA-2 (adapted from [10]). Symbols used to represent N-glycans: blue squares: N-acetylglucosamine, green circles: mannose.

