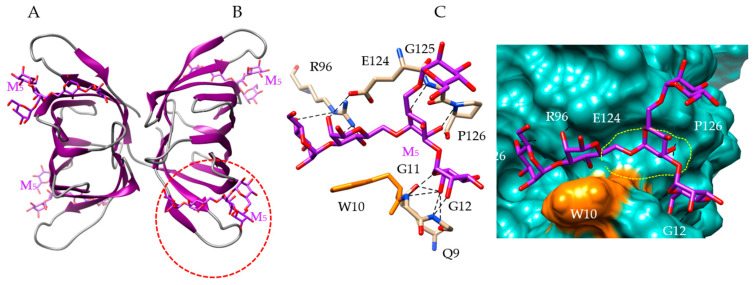
Figure 8.
Molecular modeling of Kappaphycus alvarezii lectin. (A) Lateral view of the ribbon diagram of the modeled KAA-2 from Kappaphycus alvarezii, in complex with a pentamannoside chain (M5, colored purple). (B) Network of hydrogen bonds (black dashed lines) anchoring M5 to the amino acid residues Q9, G11, G12, R96, E124, G125 and P126 forming the CBS (red dashed circle) of KAA-1. The aromatic residue W10 which also participates in stacking interaction with M5, is colored orange. (C) Molecular surface (colored slate green) at the CBS of KAA-2, forming a large depression (delineated by a yellow dashed line) harboring M5 (M5, colored purple) linked by a network of hydrogen bonds (black dashed lines) to Q9, G11, G12, R96, E124, G125 and P126 residues, and a stacking interaction with W10 residue (colored orange).

