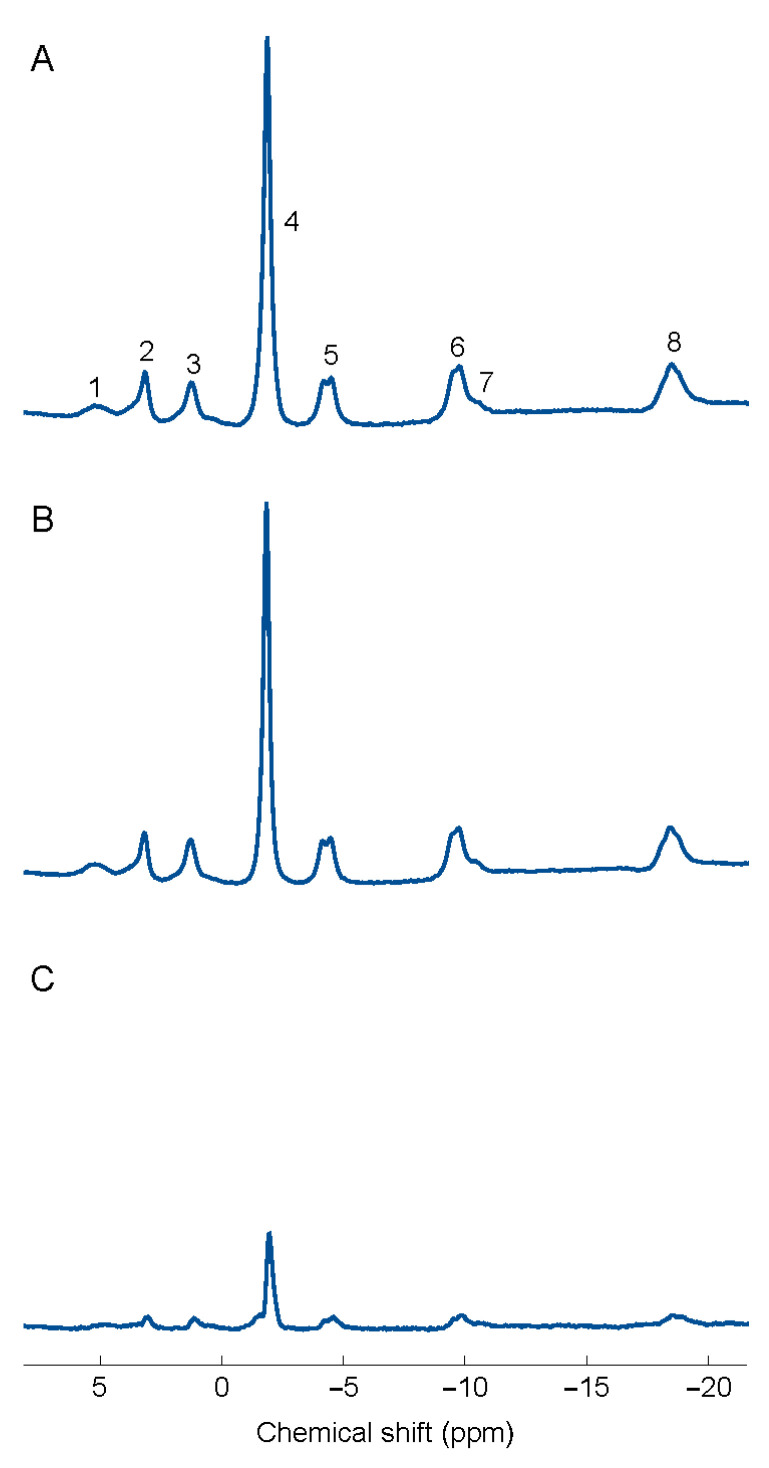
Figure 2.
Spectra corresponding to the mean for the (A) control group (n = 30) and the corresponding (B) patient group with fibromyalgia (n = 32) in the spinal erectors at 3 T. Spectra are all normalized in Table (1) Phosphomonoesters(PME), (2) inorganic phosphate (Pi), (3) phosphodiesters (PDE), (4) phosphocreatine (PCr), (568) γ, α, and β-nucleotide triphosphate (mainly Mg-saturated ATP), and (7) NAD(H). (C) The difference between the two groups of subjects.

