
Figure 3.
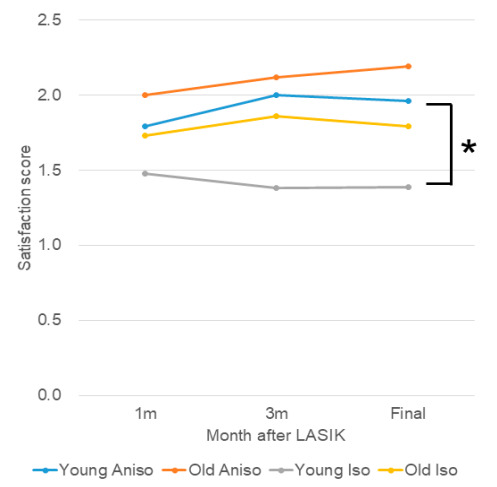
Satisfaction score stratified by anisometropia. The final satisfaction scores of the younger anisometropic group was poorer than the score of the younger isometropic group (* p = 0.002), whereas there was no difference between the older groups. Blue, younger anisotropic group; red, older anisometropic group; grey, younger isometropic group; yellow, older isometropic group.