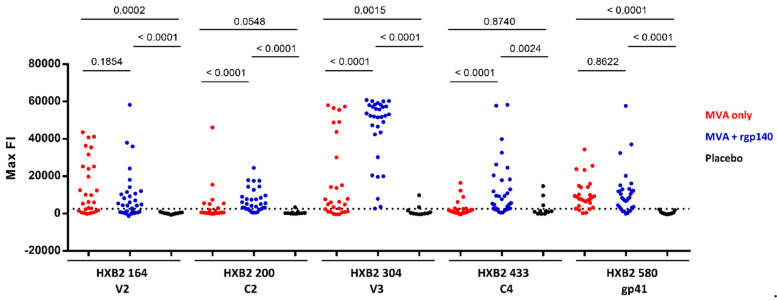
Figure 2.
Statistical analysis of the IgG response against linear HIV-1 Env epitopes. Maximum FI of each vaccinee in the three vaccination arms given for the 5 IDRs. Maximum FI for each peptide position was chosen from the 10 full-length Env sequences included in the array. The dotted line represents the 2500 FI cut-off for positive responses. Corresponding HXB2 positions are given for all IDRs. The p-values comparing vaccination arms and placebo group were calculated using the Mann–Whitney U test. HIV-MVA only n = 28; HIV-MVA + CN54rgp140/GLA-AF n = 32; Placebo n = 11.

